The DS Group, one of India’s leading conglomerates, is famous for its diverse portfolio of products. With an annual revenue of over ₹5,500 crore (around US$640 million), it has left its mark in sectors like food and beverages, hospitality, and more. Among its many achievements, Pulse Candy stands out as a shining example of how understanding consumers, combined with innovation and strategic marketing, can lead to phenomenal success.
The DS Group: A Legacy of Excellence
Founded in 1929 by Dharampal Gulati and Satpal Gulati, the DS Group started as a small grocery store in Kolkata. Over the years, it expanded into multiple industries, with some of its popular brands being:
-Mouth Fresheners: Rajnigandha, Pass Pass
-Food and Beverages: Catch, Ksheer
-Confectionery: Pulse
-Hospitality: The Leela Palaces, Hotels and Resorts
This growth reflects the group’s ability to adapt and innovate over nearly a century.

The Birth of Pulse Candy: A Tangy Delight
Pulse Candy was inspired by India’s love for tangy flavors, especially raw mango (kaccha aam). This flavor isn’t just delicious—it’s deeply rooted in Indian culinary traditions, evoking fond memories of childhood for many.
The DS Group tapped into this nostalgia and created a candy with a unique combination of tangy, spicy, and sweet flavors. This understanding of sensory preferences played a crucial role in Pulse’s success.
What Is Sensory-Specific Satiety?
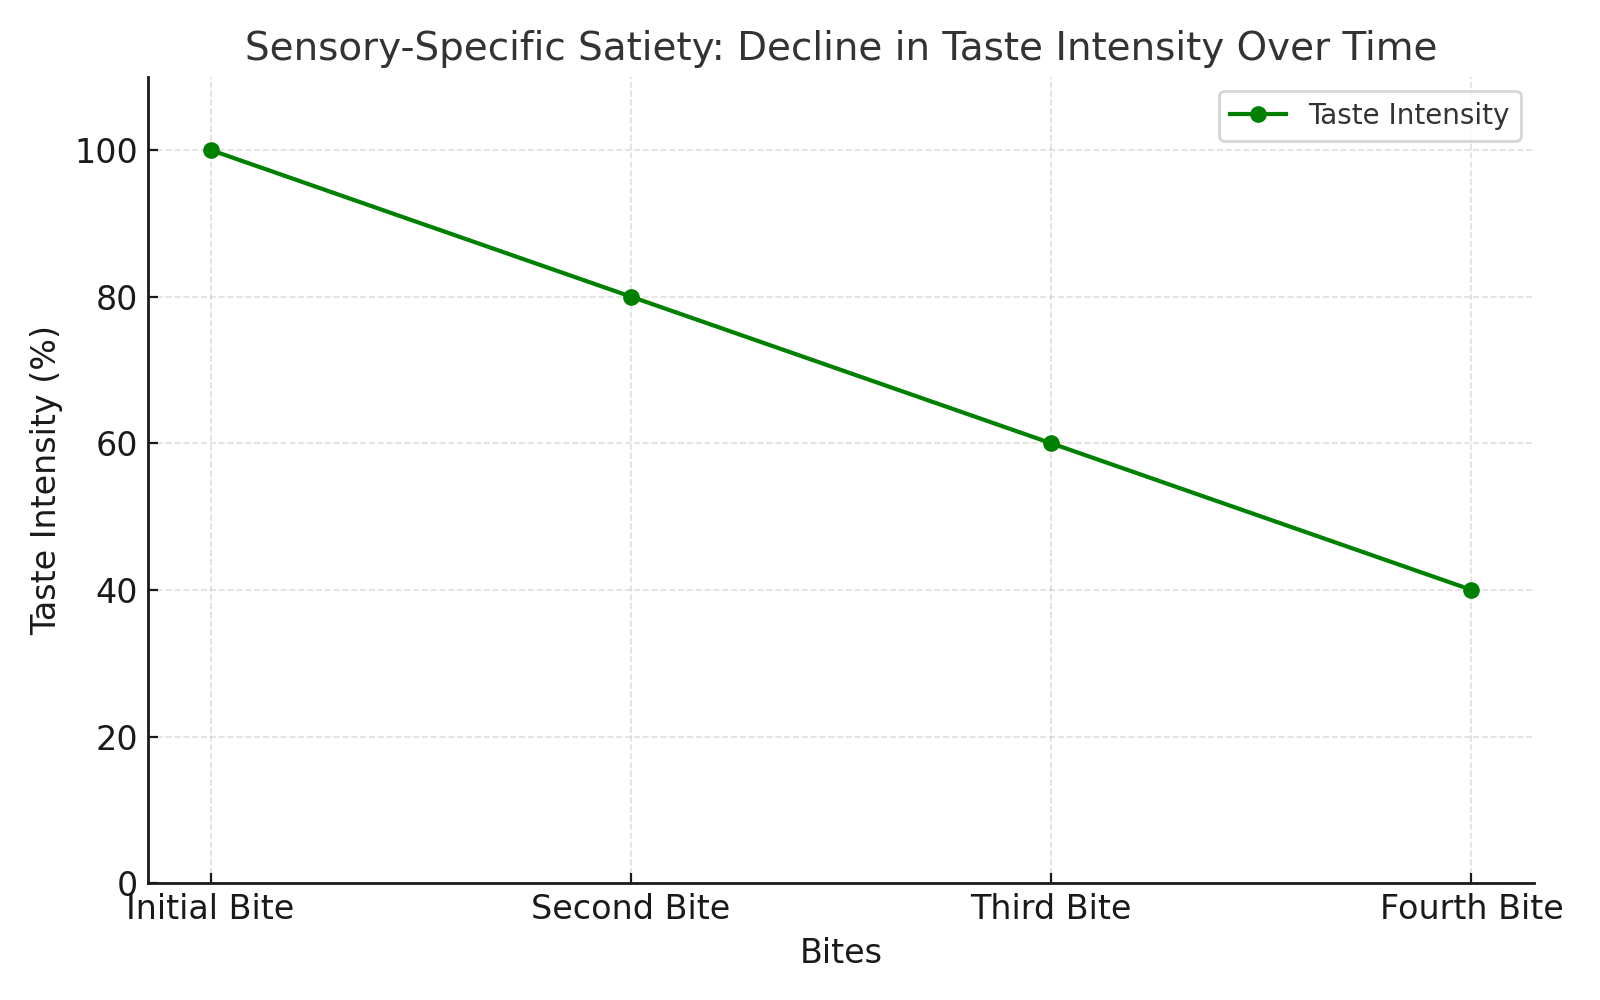
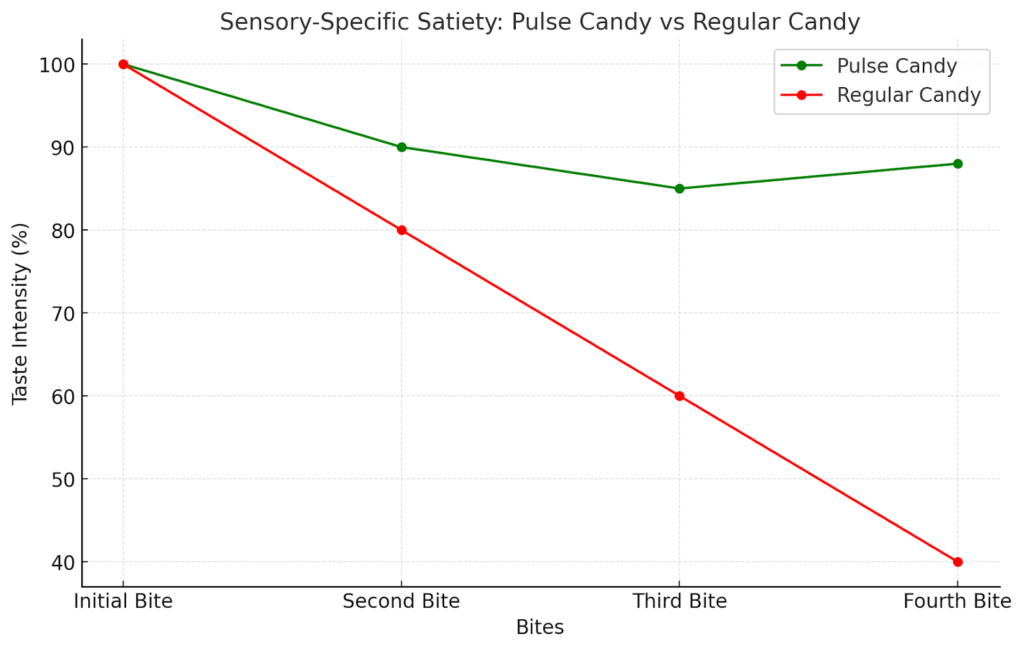
Sensory-specific satiety refers to the tendency of our taste buds to get bored of the same flavor over time, encouraging us to seek variety. Pulse Candy cleverly countered this by blending tangy, spicy, and sweet notes. This dynamic taste ensured the candy stayed exciting, keeping consumers coming back for more.
Challenges and Smart Solutions
Launching Pulse Candy wasn’t without its challenges. Here’s how the DS Group tackled them:
1. Tough Competition
The Indian candy market was crowded with well-established brands. Breaking through required a unique product and bold strategies.
2. Consumer Skepticism
Introducing a new candy flavor was risky. Would consumers embrace it? The DS Group addressed this by carefully testing the product in smaller markets first.
3. Distribution Hurdles
India’s vast geography posed logistical challenges. To ensure availability, the company built a strong distribution network, reaching even the remotest areas.
A Strategic Launch: Small Steps to Big Wins
Instead of going all-in at once, the DS Group took a calculated risk by launching Pulse Candy in three states—Rajasthan, Gujarat, and Delhi. This allowed them to collect consumer feedback and make improvements before expanding nationwide.
Marketing That Made an Impact
The marketing strategy behind Pulse Candy was equally impressive. Here’s what worked:
1. Digital Marketing and Influencers
The DS Group used social media to connect with consumers. Collaborations with food bloggers like Food_Lover_Raj on Instagram and Spice_Queen_Sita on YouTube helped spread the word. These influencers highlighted Pulse’s tangy flavor and nostalgic appeal, driving curiosity and trust among their audiences.
2. Contests and Engagement
Interactive campaigns like sharing childhood memories of eating raw mangoes helped create an emotional bond with the brand. Online contests generated excitement and turned casual buyers into loyal fans.
The Results: A Phenomenal Success
The response to Pulse Candy was overwhelming. Its flavor, nostalgia factor, and affordability made it a runaway hit. Key milestones include:
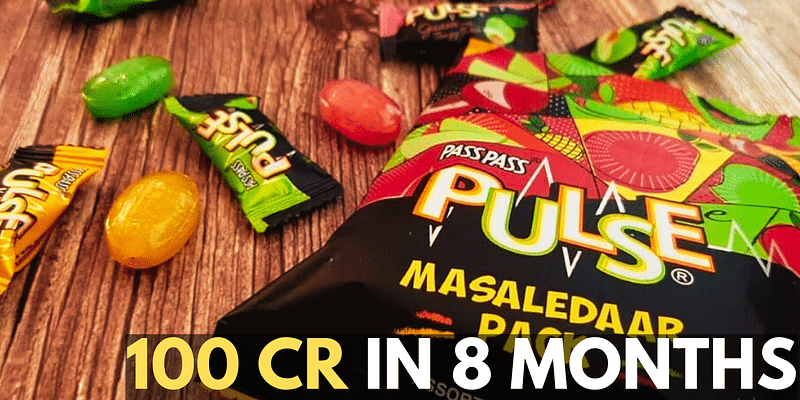
-Sales Milestones: ₹100 crore (US$12 million) in the first 8 months and ₹300 crore (US$36 million) in two years.
-Market Share: Pulse achieved over 15% of the hard-boiled candy market within 2 years.
-Consumer Love: Word-of-mouth marketing played a huge role in its success, amplifying the brand’s popularity.
Lessons from Pulse Candy’s Success
Pulse Candy’s journey offers valuable lessons for businesses:
–Understand Your Consumers
Knowing what your audience loves—like tangy raw mango—can set your product apart.
-Leverage Nostalgia
Tapping into emotions, such as childhood memories, creates a strong connection with your brand.
-Start Small, Scale Big
Testing your product in select markets minimizes risk and maximizes chances of success.
-Use Digital Marketing
Social media and influencer collaborations are essential for reaching today’s consumers.
-Engage Your Audience
Building a community through interactive campaigns fosters loyalty and advocacy.
A Sweet Future Ahead
Pulse Candy remains a beloved treat, and the DS Group continues to innovate with new flavors. Their success with Pulse is a reminder of the power of understanding consumers, embracing innovation, and executing effective marketing strategies.
Whether you’re a marketer or an entrepreneur, the story of Pulse Candy is a perfect case study in turning a simple idea into a massive success.
At Balistro, we specialize in helping businesses grow through effective digital marketing strategies. From Google Ads to Meta Ads, we deliver data-driven campaigns that maximize your ROI and drive real results. If you’re looking to boost your online presence, generate leads, or scale your e-commerce business, our expert team is here to help. Contact us today to learn more about how we can support your advertising needs!
Ready to Grow Your Business?
Book a free 30-minute strategy call with Balistro. We’ll audit your marketing and show you exactly where your biggest growth opportunities are.
The Digital Marketing Engine Behind Pulse Candy’s Cult Following
Pulse candy’s success is not just a product story — it’s a masterclass in how a traditional FMCG brand can leverage digital marketing to create a youth-driven cult following. At a time when Indian consumers were being bombarded with premium chocolate brands, DS Foods chose to double down on nostalgia, humour, and raw digital authenticity.
Social Media Strategy: Memes Over Marketing
Pulse’s social media playbook broke every rule in the FMCG marketing handbook. Instead of polished brand content, they leaned hard into meme culture — relatable, shareable, and aggressively informal. The result was organic reach that most brands spend crores of rupees trying to buy. Their Facebook and Instagram pages became community hubs where the audience created as much content as the brand.
This is a critical lesson for any brand: earned media at scale requires giving your audience something worth sharing. Pulse made that easy — their tangy-sweet flavour experience was inherently shareable, and their content reflected that emotional truth.
Influencer Marketing Without the Big Budget
Rather than signing expensive celebrity endorsements, Pulse chose micro and nano influencers in the food and lifestyle space — creators with highly engaged audiences in Tier 1 and Tier 2 cities. The ROI on this approach dwarfs traditional celebrity campaigns because the trust signal is stronger and the cost per engagement is a fraction of the price.
Key Marketing Lessons from Pulse Candy’s Growth Story
- Scarcity drives desire: The early “sold out everywhere” narrative wasn’t just PR — it was real. Brands that manufacture demand through controlled supply create organic buzz that money can’t buy.
- Price point is a marketing decision: At ₹5, Pulse was accessible to everyone. This democratised the product and fuelled word-of-mouth across every demographic.
- Authenticity beats production quality: Pulse’s early social content was rough, funny, and real. It didn’t look like an ad — and that was the point. Audiences in 2026 can detect inauthenticity instantly.
- Nostalgia is a conversion trigger: Tapping into the “school tuck shop” memory of an entire generation created emotional resonance that no amount of product advertising could replicate.
What Your Brand Can Learn and Apply Today
The Pulse Candy playbook is transferable to almost any consumer brand. The formula: identify your product’s emotional truth, build content around that truth, distribute it through channels your audience actually uses, and make it shareable by default.
For D2C brands and FMCG companies looking to replicate this kind of growth, the investment required is not in media spend — it’s in understanding your customer deeply enough to create content they want to share. That’s the real Pulse formula.
Want to build a digital marketing strategy that creates the same kind of brand loyalty for your business? Book a free strategy call with Balistro Consultancy.
Ready to grow with Digital Marketing?
Balistro works with FMCG and D2C brands to create integrated digital marketing strategies that scale awareness, acquisition and retention. Learn more about our Digital Marketing services →
Why Strategic Digital Marketing Is Essential for Business Growth in India
India’s digital advertising market is projected to reach ₹62,000 crore by 2026, growing at 25% CAGR (Source: Dentsu Digital Report). This explosive growth means more businesses are competing for digital attention than ever before. Without a strategic digital marketing approach, brands risk being invisible to their target audience.
The most successful brands in India’s digital landscape don’t rely on a single channel — they build integrated marketing ecosystems. Brands using 3+ digital channels see 287% higher purchase rates than single-channel campaigns (Source: Omnisend). This multi-channel approach, when executed strategically, creates multiple touchpoints throughout the customer journey.
For D2C and B2B brands specifically, digital marketing has become the primary growth driver. With 78% of Indian businesses increasing their digital marketing budgets in 2025, the competitive landscape demands not just presence but excellence across search, social, email, and content channels.
Building an Integrated Digital Marketing Strategy
- Customer Research & Persona Development: Start with deep customer research — analyze your existing customer data, conduct surveys, review search queries, and study competitor audiences. Build detailed buyer personas including demographics, pain points, digital behavior, and preferred content formats.
- Channel Strategy & Prioritization: Not every channel is right for every business. D2C brands should prioritize Meta Ads, Google Shopping, email marketing, and SEO. B2B brands focus on Google Search, LinkedIn, content marketing, and email nurturing. Start with 2-3 core channels and expand based on data.
- Content Strategy & Calendar: Develop a content strategy that supports every stage of the funnel — awareness (blog posts, social content), consideration (case studies, comparison guides), and decision (product pages, testimonials). Create a monthly content calendar with themes aligned to business goals and seasonal opportunities.
- Paid Media Strategy: Structure paid campaigns by funnel stage with appropriate budgets. Allocate 40% to prospecting (awareness), 30% to remarketing (consideration), and 30% to conversion campaigns. Use cross-channel remarketing to nurture prospects across platforms.
- Measurement & Optimization: Implement comprehensive tracking across all channels. Build a unified dashboard that shows the complete customer journey. Use data to continuously optimize — shift budget to top-performing channels, refine targeting, and improve creative based on performance insights.
Digital Marketing Mistakes That Stunt Business Growth
- No clear strategy or goals: Running ads and posting content without a coherent strategy wastes budget and effort. Define specific, measurable goals for each channel — traffic, leads, revenue — and build campaigns that directly support those objectives.
- Channel silos: Running each marketing channel independently creates disconnected customer experiences and misses cross-channel optimization opportunities. Integrate your channels so email supports paid media, content supports SEO, and social supports brand building in a cohesive ecosystem.
- Chasing trends over fundamentals: New platforms and tactics are exciting, but sustainable growth comes from mastering fundamentals — compelling messaging, strong offers, excellent landing pages, and data-driven optimization. Build a strong foundation before experimenting with emerging channels.
- Underinvesting in retention: Most brands overspend on acquisition and underinvest in retention. Retaining existing customers costs 5-7x less than acquiring new ones. Build email automation, loyalty programs, and post-purchase experiences that maximize customer lifetime value.
- Not investing in brand: Performance marketing drives immediate results, but brand building creates long-term competitive advantage. Strong brands enjoy higher conversion rates, lower acquisition costs, and greater pricing power. Allocate at least 20-30% of marketing budget to brand-building activities.
Frequently Asked Questions
How much should a small business spend on digital marketing in India?
Small businesses in India should allocate 7-15% of revenue to digital marketing, with a minimum of ₹25,000-50,000 per month for meaningful impact. Start with the channels most likely to drive immediate revenue — Google Ads for intent-based traffic and social media ads for awareness — then expand as you see returns.
What is the most effective digital marketing channel for B2B?
For B2B companies in India, Google Search Ads and LinkedIn are typically the most effective channels for lead generation. Content marketing and SEO build long-term authority and organic lead flow. Email marketing nurtures leads through longer B2B sales cycles. The optimal mix depends on your industry, target audience, and sales process.
How do I measure digital marketing success?
Measure success against your business objectives: revenue growth, customer acquisition cost (CAC), return on ad spend (ROAS), organic traffic growth, conversion rates, and customer lifetime value (CLV). Avoid vanity metrics like impressions or followers unless they directly correlate with business outcomes. Set up proper attribution to understand which channels drive real results.
Ready to Grow Your Business?
At Balistro Consultancy, we help D2C and B2B brands achieve measurable marketing results through data-driven strategies. Whether you need Google Ads management, Facebook advertising, SEO services, or email marketing, our team of certified specialists is ready to help you grow.
Book a free consultation call to discuss your marketing goals and discover how Balistro can drive real results for your brand.
