
Why Most Brands Are Flying Blind on Marketing ROI
Ask most marketing teams what their marketing ROI is and they will struggle to give you a confident answer. They may know their total ad spend and their total revenue, but they cannot tell you which channels are profitable, which campaigns are wasting money, which customer segments have the best lifetime value, or where in the funnel they are losing the most potential customers.
This is not a strategy problem — it is a data problem. And the brands that solve this data problem unlock a fundamental competitive advantage: the ability to continuously reallocate budget from what is not working to what is, compounding marketing performance over time.
At Balistro Consultancy, our data analytics team helps D2C and B2B brands build the marketing intelligence infrastructure they need to make these decisions confidently. Here is the practical framework we use.
The Metrics That Actually Drive ROI Improvement
Not all marketing metrics are equally useful. Many brands track vanity metrics (impressions, followers, page views) while ignoring the metrics that actually inform ROI decisions. The metrics that matter are:
Acquisition Metrics
- Customer Acquisition Cost (CAC) by channel: How much does it cost to acquire a new customer from Meta Ads, Google Ads, email marketing, organic search, and each other channel? CAC per channel reveals which channels are efficient and which are overpriced.
- Cost Per Lead (CPL) by channel: For B2B brands, CPL by channel and by campaign helps identify the most cost-efficient lead sources
- ROAS (Return on Ad Spend): Revenue generated per rupee of advertising spent — the primary efficiency metric for paid acquisition
Conversion Metrics
- Conversion rate by traffic source: Not all traffic converts equally. Organic search traffic often converts 3-4x better than paid traffic. Understanding this helps you allocate content and SEO budgets more intelligently.
- Landing page conversion rates: Identifying which landing pages convert well vs. poorly reveals optimisation opportunities that can dramatically improve ROAS without increasing spend
- Checkout abandonment rate: Every percentage point improvement in checkout completion directly improves revenue without additional acquisition cost
Retention Metrics
- Customer Lifetime Value (LTV) by acquisition cohort: Customers acquired through different channels often have very different LTV profiles. A channel with a higher CAC may still be profitable if its customers have 2x the LTV.
- Repeat purchase rate: What percentage of first-time buyers make a second purchase? The gap between your current repeat purchase rate and 35-40% (a typical healthy rate for D2C) represents recoverable revenue.
- Cohort retention curves: How does retention change across customer acquisition cohorts over time? Improving cohort retention is the most reliable way to improve long-term marketing ROI.
Building Your Marketing Data Stack
Measuring the metrics above requires connecting the right data sources. A practical marketing data stack for a growth-stage brand includes:
GA4: Your Website Intelligence Layer
Google Analytics 4 is the foundation of marketing measurement. Properly configured, GA4 tracks every user touchpoint from first visit to conversion, building a picture of the complete customer journey. Critical GA4 configurations:
- Conversion events properly set up for all key actions (purchase, lead form submission, add to cart, checkout start)
- Enhanced e-commerce tracking for detailed product and revenue data
- UTM parameter consistency across all marketing channels for accurate source attribution
- Data-driven attribution model enabled
- GA4 linked to Google Ads, Search Console, and BigQuery for deeper analysis
Ad Platform Data: Meta and Google Ads
Each ad platform provides its own attribution data, which should be collected alongside GA4 data. Important: always compare platform-reported ROAS with GA4-reported revenue to identify discrepancy — most brands find platform ROAS is significantly inflated due to overlapping attribution windows.
CRM Data: Customer Lifetime Value
Your CRM (Shopify, WooCommerce, or a dedicated CRM) contains the customer lifetime value data that transforms your understanding of channel profitability. When you can connect acquisition source to LTV, channels that looked expensive (high CAC) may prove highly profitable, and channels that looked cheap (low CAC) may prove loss-making on an LTV basis.
Finding Waste in Your Ad Spend With Data
Most brands running paid campaigns are wasting 20-30% of their budget on poorly performing campaigns, audiences, or creatives that are not being paused fast enough. A data-driven audit typically reveals:
- Underperforming ad creatives: Creatives with above-average CPM and below-average CTR — the algorithm is serving them but audiences are not responding
- Unprofitable audience segments: Ad sets targeting audiences with high spend but below-target ROAS
- Geographic inefficiency: Certain cities or regions converting at a fraction of the ROAS achieved in others, yet receiving equal budget allocation
- Time-of-day and day-of-week patterns: Ad spend during low-conversion periods (late night, early morning) that could be shifted to peak conversion windows
- Keyword waste in Google Ads: Search terms triggering ads that are completely irrelevant to your product, wasting impression share and budget
Identifying and eliminating this waste typically improves effective ROAS by 15-25% with zero increase in spend.
Using Cohort Analysis for Retention Improvement
Cohort analysis groups customers by their acquisition month and tracks their purchasing behaviour over time. This reveals which acquisition cohorts have the best retention — and often which marketing channels produced those cohorts.
A simple cohort analysis framework:
- Group customers by first purchase month
- Track what percentage of each cohort makes a second purchase within 30, 60, and 90 days
- Compare retention rates across cohorts — are recently acquired customers retaining better or worse than older cohorts?
- Cross-reference with acquisition channel — do Meta-acquired customers retain better than Google-acquired customers?
- Use this data to adjust channel budget allocation and retention marketing intensity
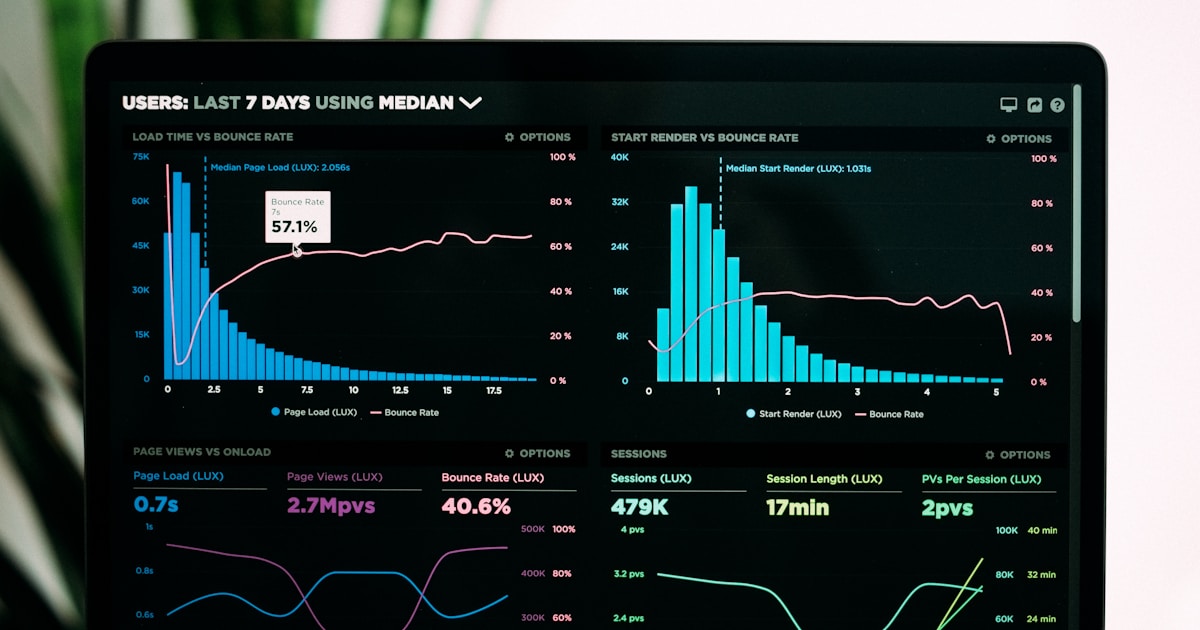
Building a Marketing Analytics Dashboard
Raw data is not actionable — a well-designed dashboard is. An effective marketing analytics dashboard consolidates:

- Daily CAC by channel with trend lines
- ROAS by campaign with week-over-week comparison
- Conversion funnel metrics from visit to purchase
- LTV cohort curves for the past 6-12 acquisition months
- Retention metrics (repeat purchase rate, average order value for repeat buyers)
- A single blended marketing efficiency ratio (total revenue / total marketing spend)
Balistro’s data analytics team builds custom marketing dashboards that pull data from GA4, Meta Ads, Google Ads, email platforms, and CRM into a unified view. Our data analytics service gives brands the intelligence they need to continuously improve marketing ROI.
How Balistro Improves Marketing ROI Through Data
Balistro has helped multiple D2C and B2B brands improve their effective marketing ROI by 30-50% through better measurement, smarter budget allocation, and data-driven creative and targeting optimisation. We build the measurement infrastructure, identify the waste and opportunities in your current spend, and then continuously optimise using data rather than intuition.
We also build custom analytics tools for marketing agencies who want to offer data-driven reporting and attribution as a premium service to their clients. Learn more about our digital marketing services.
Ready to Build Your Marketing Analytics Advantage?
If you are making marketing budget decisions based on incomplete data, you are almost certainly misallocating a significant portion of your budget. Balistro can help you build the data infrastructure to change that.
Book a free analytics audit with the Balistro team and we will show you exactly what data you should be collecting and how to use it to improve your marketing ROI.
Why Data Analytics Is the Foundation of Marketing Success
In an era where companies that adopt data-driven marketing are 23x more likely to acquire customers (Source: McKinsey), data analytics has become the competitive differentiator between brands that grow and brands that guess. For Indian businesses investing in digital marketing, analytics transforms ad spend from a cost center into a precision growth engine.

The transition to GA4 and the evolution of marketing attribution have created both challenges and opportunities. Brands that invest in proper analytics infrastructure — comprehensive tracking, custom dashboards, and multi-touch attribution — make better decisions faster. Organizations using real-time dashboards make decisions 5x faster than those relying on manual reports (Source: Domo).
Beyond measurement, modern analytics enables predictive marketing — using historical data to forecast future performance, identify high-value customer segments, and optimize budget allocation before spending a single rupee. This proactive approach to marketing optimization is what separates market leaders from followers.
Setting Up a Marketing Analytics System That Drives Decisions
- GA4 Configuration & Event Tracking: Implement GA4 with comprehensive event tracking — page views, scroll depth, button clicks, form submissions, and e-commerce events (view item, add to cart, purchase). Configure enhanced measurement and set up custom events for business-specific interactions.
- Conversion Tracking Across Platforms: Install tracking pixels for all advertising platforms (Google Ads, Meta Pixel, LinkedIn Insight Tag). Implement server-side tracking via Google Tag Manager Server Side or platform-specific APIs for more accurate attribution, especially given iOS privacy changes.
- Custom Dashboard Creation: Build dashboards in Google Looker Studio that connect to all your data sources — GA4, Google Ads, Meta Ads, CRM, and e-commerce platforms. Create views for different stakeholders: executive overview (KPIs and trends), marketing team (campaign performance), and finance (ROI and budget tracking).
- Attribution Modeling: Move beyond last-click attribution to data-driven or multi-touch models. Understand the contribution of each touchpoint in the customer journey. Use attribution insights to allocate budget to channels that truly drive conversions, not just those that happen to be the last click.
- Reporting Cadence & Action Framework: Establish a reporting rhythm: daily performance checks, weekly optimization meetings, monthly strategic reviews, and quarterly business reviews. Every report should include not just data, but actionable recommendations based on the insights.
Data Analytics Mistakes That Lead to Bad Marketing Decisions
- Tracking too many metrics: Dashboard overload leads to analysis paralysis. Focus on 5-7 core KPIs that directly tie to business objectives. Everything else is supporting detail, not a primary decision metric.
- Relying solely on last-click attribution: Last-click attribution overvalues bottom-funnel channels and undervalues awareness and consideration touchpoints. This leads to underinvestment in top-of-funnel campaigns that actually drive growth.
- Not validating data accuracy: Garbage in, garbage out. Regularly audit your tracking setup — check that conversion events fire correctly, tag implementations are consistent, and data sources align. Inaccurate data leads to confidently wrong decisions.
- Making decisions on insufficient data: Statistical significance matters. Don’t optimize based on small sample sizes or short time periods. Most campaign optimizations need at least 100 conversions and 2-4 weeks of data to be reliable.
- Ignoring qualitative data: Numbers tell you what happened; qualitative data tells you why. Combine analytics with customer feedback, surveys, heatmaps, and session recordings for a complete picture of user behavior and motivation.
Frequently Asked Questions
What is the difference between GA4 and Universal Analytics?
GA4 uses an event-based data model where every interaction is an event, while Universal Analytics used a session-based model with pageviews, events, and transactions as separate hit types. GA4 offers cross-platform tracking, machine learning-powered insights, and privacy-centric measurement. Since Universal Analytics was discontinued, GA4 is now the standard for web analytics.
How do I choose the right marketing attribution model?
The best attribution model depends on your business. Data-driven attribution (available in GA4 and Google Ads) is generally recommended as it uses machine learning to assign credit based on actual conversion paths. For businesses with shorter sales cycles, position-based attribution works well. Longer B2B sales cycles benefit from linear or time-decay models that credit multiple touchpoints.
What should a marketing dashboard include?
An effective marketing dashboard should include: traffic overview (sessions, users, sources), conversion metrics (conversion rate, revenue, leads), advertising performance (spend, ROAS, CPA), channel comparison, and trend analysis. Include both real-time data for daily monitoring and historical trends for strategic planning. Balistro builds custom Looker Studio dashboards tailored to each client’s specific KPIs.
Ready to Grow Your Business?
At Balistro Consultancy, we help D2C and B2B brands achieve measurable marketing results through data-driven strategies. Whether you need Google Ads management, Facebook advertising, SEO services, or email marketing, our team of certified specialists is ready to help you grow.
Book a free consultation call to discuss your marketing goals and discover how Balistro can drive real results for your brand.
