
Why Standard Reporting Tools Are Not Enough for Agencies
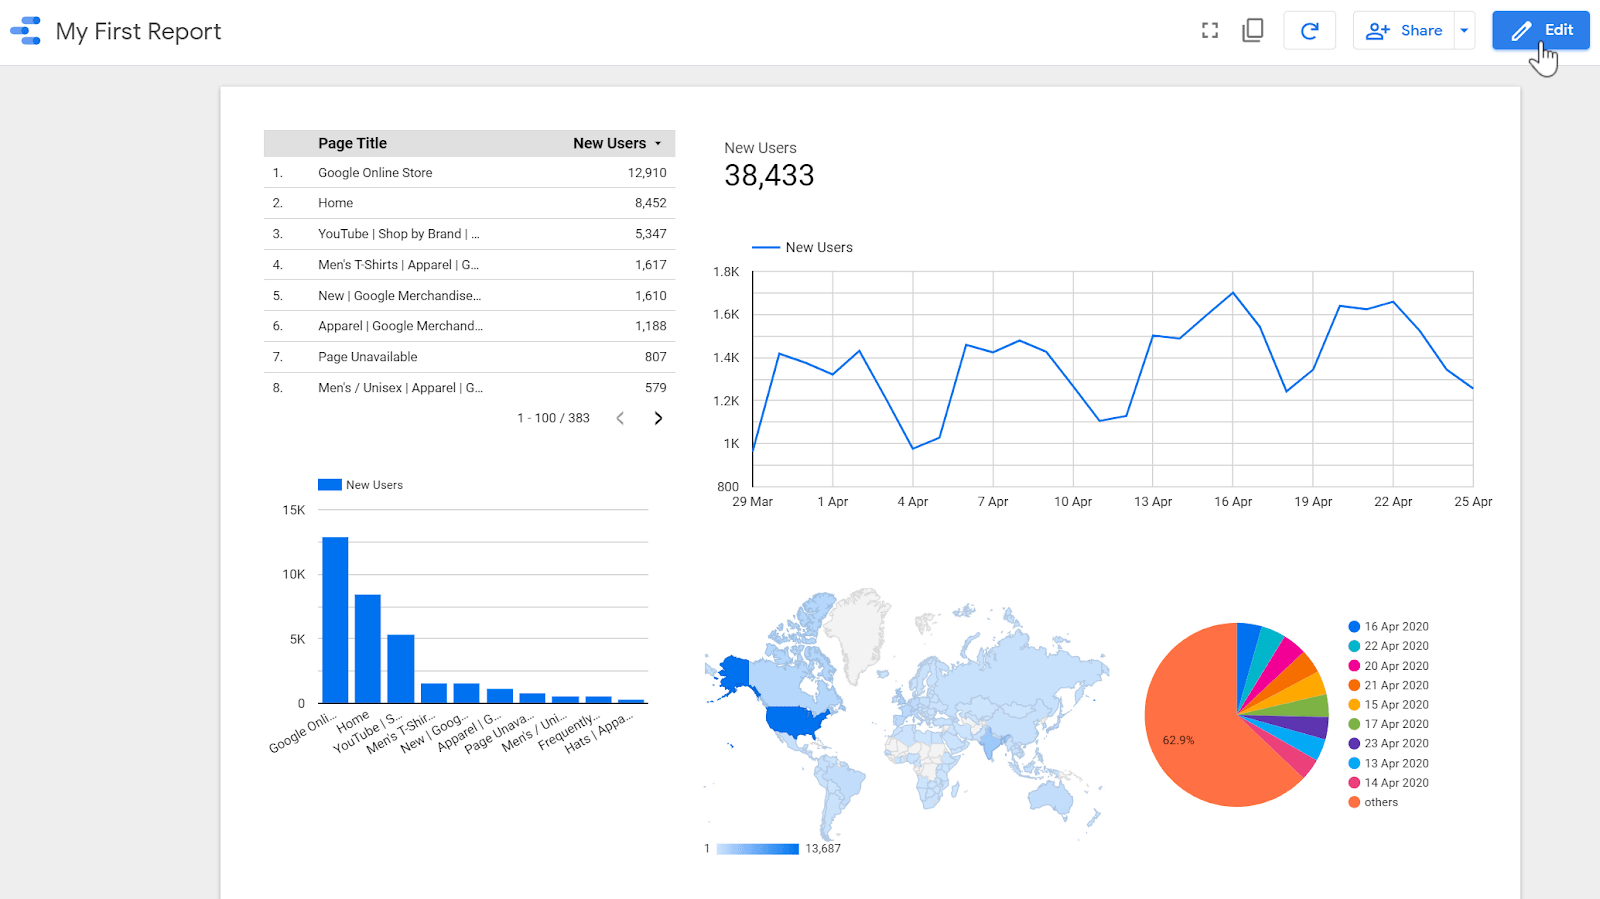
Google Looker Studio is free, connects to most data sources, and can produce visually clean reports. So why are so many agencies still spending hours every month on manual reporting? Because the gap between what Looker Studio does out of the box and what agencies actually need is wider than most people realise.
Default Looker Studio templates show generic metrics in generic formats. Agencies need reports that reflect client-specific KPIs, show cross-channel performance in a unified view, update automatically without manual data pulls, carry agency branding, and tell a clear performance story rather than just displaying numbers. Getting all of this from a default Looker Studio setup requires hours of configuration per client — and every time a client is onboarded, you start the configuration process again.
Custom marketing dashboards solve this at scale. This guide explains what to include in a custom agency dashboard, why it matters, and how Balistro Consultancy builds them.
The Limits of Default Looker Studio Dashboards
Looker Studio is a powerful platform, but agencies hit its limits quickly in several areas.
Cross-channel attribution is hard: Showing how paid search, paid social, organic, and email all contribute to the same conversion requires custom blended data sources and attribution modelling that Looker Studio does not handle natively. Most default dashboards show channel performance in isolation, which gives clients an incomplete and sometimes misleading picture of ROI.
Client-specific KPIs require heavy customisation: Different clients measure success differently. An e-commerce client might care about ROAS, average order value, and new customer acquisition cost. A SaaS client wants to see MQL volume, SQL conversion rate, and pipeline influenced. A local services business focuses on leads, call volume, and cost per lead. Building separate dashboards for each KPI set from scratch takes significant time.
Data freshness requires manual intervention: Some data connectors in Looker Studio require manual refreshing or have significant delays. Clients who expect live or near-live data are disappointed by 24-hour delays or having to request a manual refresh.
White-labelling is limited: Looker Studio reports can carry custom colours and logos, but the overall experience still feels like a Google product, not a branded agency deliverable. Custom-built dashboards can be fully white-labelled with your agency domain, design system, and branding.
What to Include in a Custom Marketing Dashboard
A well-designed custom agency dashboard typically includes five core components.
Cross-channel performance overview: A unified view of all active marketing channels — paid search, paid social, organic search, email, and social media — showing total spend, total conversions, blended ROAS, and trend lines over the selected date range. This is the executive summary view that clients look at first.
Channel drill-downs: Separate views for each channel with channel-specific metrics. The Google Ads view shows impressions, clicks, CTR, CPC, conversions, and ROAS at campaign and ad group level. The Facebook Ads view shows reach, frequency, CPM, CTR, and ROAS. Each channel view is formatted to match how that channel measures performance.
Goal and KPI tracking: Client-specific KPI tiles that show current performance against agreed targets. If the client goal is 500 leads per month and you are at 320 in week two, that needs to be visible immediately — not buried in a channel-specific table.
Automated data pulls: All data should refresh automatically on a defined schedule — typically every 24 hours or every hour for time-sensitive metrics. No manual exports, no data entry. The dashboard is always current when the client logs in.
AI-generated insights: The most advanced custom dashboards include an insights section where AI analyses the performance data and generates a written summary — identifying what is working, what needs attention, and what actions are recommended. This turns the dashboard from a passive data display into an active performance management tool.
White-Label Client Reporting
Beyond internal agency use, custom dashboards enable a client experience that generic tools simply cannot match. A white-label client reporting portal with your agency branding gives clients a single destination to see their performance, access historical reports, and track progress against goals.
Agencies that deploy custom client portals consistently report improved client retention, faster upsell cycles, and fewer ad hoc reporting requests — because clients have the information they need available whenever they want it, rather than waiting for monthly PDF reports.

Balistro Builds Custom Dashboards for Agencies and Brands
At Balistro Consultancy, our data analytics and dashboard services include building custom marketing dashboards for agencies and brands. We connect all your data sources — Google Ads, Meta Ads, Google Analytics 4, Search Console, email platforms, and any custom data sources — into a unified custom dashboard built to your specifications.
Our dashboards are built on modern infrastructure with automated data pipeline management, real-time or near-real-time data refresh, and full white-label options. We build both the data backend and the frontend reporting interface, and we hand over fully documented systems that your team can maintain and extend.
We also build dashboard tools as standalone products for agencies — a single platform that manages all client dashboards from one admin interface, allowing you to onboard a new client and have their dashboard live within hours rather than weeks.
Our Google Ads and Facebook Ads teams use these dashboards daily for our own clients, so every dashboard we build is designed by people who actually manage campaigns — not just developers building to a specification.
The Build Once, Report Forever Principle
The title of this post captures the core value proposition of custom dashboards. The investment is in the build — designing the data architecture, building the connections, configuring the views, and testing the output. Once built, a custom dashboard runs indefinitely with minimal maintenance, automatically pulling and displaying current data for every client without any manual effort.
Contrast this with the alternative: spending two to four hours per client per month manually compiling, formatting, and sending reports. If you have twenty clients, that is 40 to 80 hours per month of reporting time. A custom dashboard that eliminates that manual work pays for itself in one to three months and continues generating value for every month thereafter.
Let Us Build Your Agency Dashboard
Whether you need a custom dashboard for your own agency operations, a white-label client reporting platform, or a standalone dashboard tool you can offer to clients, Balistro Consultancy has the data engineering and product development expertise to build it.
Book a consultation with Balistro to discuss your dashboard requirements and get a scoping proposal for a custom reporting system that will transform how your agency manages and communicates performance.
Why Data Analytics Is the Foundation of Marketing Success
In an era where companies that adopt data-driven marketing are 23x more likely to acquire customers (Source: McKinsey), data analytics has become the competitive differentiator between brands that grow and brands that guess. For Indian businesses investing in digital marketing, analytics transforms ad spend from a cost center into a precision growth engine.
The transition to GA4 and the evolution of marketing attribution have created both challenges and opportunities. Brands that invest in proper analytics infrastructure — comprehensive tracking, custom dashboards, and multi-touch attribution — make better decisions faster. Organizations using real-time dashboards make decisions 5x faster than those relying on manual reports (Source: Domo).
Beyond measurement, modern analytics enables predictive marketing — using historical data to forecast future performance, identify high-value customer segments, and optimize budget allocation before spending a single rupee. This proactive approach to marketing optimization is what separates market leaders from followers.
Setting Up a Marketing Analytics System That Drives Decisions
- GA4 Configuration & Event Tracking: Implement GA4 with comprehensive event tracking — page views, scroll depth, button clicks, form submissions, and e-commerce events (view item, add to cart, purchase). Configure enhanced measurement and set up custom events for business-specific interactions.
- Conversion Tracking Across Platforms: Install tracking pixels for all advertising platforms (Google Ads, Meta Pixel, LinkedIn Insight Tag). Implement server-side tracking via Google Tag Manager Server Side or platform-specific APIs for more accurate attribution, especially given iOS privacy changes.
- Custom Dashboard Creation: Build dashboards in Google Looker Studio that connect to all your data sources — GA4, Google Ads, Meta Ads, CRM, and e-commerce platforms. Create views for different stakeholders: executive overview (KPIs and trends), marketing team (campaign performance), and finance (ROI and budget tracking).
- Attribution Modeling: Move beyond last-click attribution to data-driven or multi-touch models. Understand the contribution of each touchpoint in the customer journey. Use attribution insights to allocate budget to channels that truly drive conversions, not just those that happen to be the last click.
- Reporting Cadence & Action Framework: Establish a reporting rhythm: daily performance checks, weekly optimization meetings, monthly strategic reviews, and quarterly business reviews. Every report should include not just data, but actionable recommendations based on the insights.
Data Analytics Mistakes That Lead to Bad Marketing Decisions
- Tracking too many metrics: Dashboard overload leads to analysis paralysis. Focus on 5-7 core KPIs that directly tie to business objectives. Everything else is supporting detail, not a primary decision metric.
- Relying solely on last-click attribution: Last-click attribution overvalues bottom-funnel channels and undervalues awareness and consideration touchpoints. This leads to underinvestment in top-of-funnel campaigns that actually drive growth.
- Not validating data accuracy: Garbage in, garbage out. Regularly audit your tracking setup — check that conversion events fire correctly, tag implementations are consistent, and data sources align. Inaccurate data leads to confidently wrong decisions.
- Making decisions on insufficient data: Statistical significance matters. Don’t optimize based on small sample sizes or short time periods. Most campaign optimizations need at least 100 conversions and 2-4 weeks of data to be reliable.
- Ignoring qualitative data: Numbers tell you what happened; qualitative data tells you why. Combine analytics with customer feedback, surveys, heatmaps, and session recordings for a complete picture of user behavior and motivation.
Frequently Asked Questions
What is the difference between GA4 and Universal Analytics?
GA4 uses an event-based data model where every interaction is an event, while Universal Analytics used a session-based model with pageviews, events, and transactions as separate hit types. GA4 offers cross-platform tracking, machine learning-powered insights, and privacy-centric measurement. Since Universal Analytics was discontinued, GA4 is now the standard for web analytics.
How do I choose the right marketing attribution model?
The best attribution model depends on your business. Data-driven attribution (available in GA4 and Google Ads) is generally recommended as it uses machine learning to assign credit based on actual conversion paths. For businesses with shorter sales cycles, position-based attribution works well. Longer B2B sales cycles benefit from linear or time-decay models that credit multiple touchpoints.
What should a marketing dashboard include?
An effective marketing dashboard should include: traffic overview (sessions, users, sources), conversion metrics (conversion rate, revenue, leads), advertising performance (spend, ROAS, CPA), channel comparison, and trend analysis. Include both real-time data for daily monitoring and historical trends for strategic planning. Balistro builds custom Looker Studio dashboards tailored to each client’s specific KPIs.
Ready to Grow Your Business?
At Balistro Consultancy, we help D2C and B2B brands achieve measurable marketing results through data-driven strategies. Whether you need Google Ads management, Facebook advertising, SEO services, or email marketing, our team of certified specialists is ready to help you grow.
Book a free consultation call to discuss your marketing goals and discover how Balistro can drive real results for your brand.
