
Most marketing teams track the wrong things. They report on impressions, follower counts, and page views — metrics that feel like progress but don’t connect to revenue. Performance marketing is about measuring what drives business results, cutting what doesn’t, and scaling what does. This guide covers every KPI that matters in 2026: paid media, SEO, email, attribution, and how to build a dashboard that drives decisions. Why Most Businesses Track the Wrong Metrics Vanity metrics are seductive because they go up. More impressions, more followers, more page views — these numbers grow even when your campaigns are losing money. The problem is they don’t tell you whether marketing is working. A campaign generating 1 million impressions and 0 sales is not a successful campaign — it’s an expensive brand exercise with no measurable return. The shift to performance-first measurement means every marketing activity should be tied, directly or indirectly, to a business outcome: revenue, leads, customers, or retention. That requires a KPI framework that connects channel metrics to business metrics to a north star goal. The KPI Hierarchy: North Star to Channel Metrics A well-structured KPI framework has three layers: North Star Metric: The single number that best captures your business health — for e-commerce it’s typically revenue or gross profit; for SaaS it’s MRR or ARR; for B2B services it’s qualified pipeline value Business KPIs: The 4–6 metrics that directly drive the north star — CAC, CLV, conversion rate, retention rate, average order value Channel KPIs: The tactical metrics within each channel — ROAS for paid media, organic sessions for SEO, open rate for email — that indicate whether channel-level execution is healthy The hierarchy matters because channel KPIs can look healthy while business KPIs deteriorate. High CTR but low conversion rate usually means your ads are attracting the wrong audience. Knowing which layer to look at prevents chasing the wrong problem. Essential Paid Media KPIs ROAS: Return on Ad Spend ROAS = Revenue Generated ÷ Ad Spend. The primary efficiency metric for e-commerce paid media. Target ROAS should be set based on your business economics — gross margin and operating costs — not industry benchmarks. A business with 60% gross margin can profitably operate at 2x ROAS; a business with 25% margin needs 5x+ to break even on paid media. Key nuances: ROAS is revenue, not profit. A 4x ROAS business with 25% gross margin is breaking even on acquisition before any overhead. Always complement ROAS with gross profit ROAS (GP-ROAS) for a true picture of paid media profitability. CAC by Channel Customer Acquisition Cost = Total Channel Spend ÷ New Customers Acquired. Track CAC separately for every channel — Google Ads, Meta Ads, LinkedIn, SEO (content production cost), email (platform cost). Blended CAC hides channel-level inefficiency. A £40 blended CAC might consist of £20 CAC from Google Search and £80 CAC from Meta Ads — without the breakout, you can’t optimize. CTR Benchmarks by Platform Click-Through Rate (CTR) indicates creative and targeting relevance. 2025–2026 benchmarks: Google Search: 3–6% average; strong campaigns hit 8–12% for branded terms, 2–4% for non-brand Google Display: 0.3–0.5% average; anything above 0.7% is strong Meta (Facebook/Instagram): 0.8–1.5% average for feed placements; strong creative hits 2–3%+ LinkedIn: 0.3–0.6% average; lead gen forms average 0.8–1.2% click-to-open Conversion Rate Benchmarks Landing page conversion rates by industry: e-commerce product pages average 2–4%, with strong performers at 5–8%. SaaS free trial pages average 5–15%. B2B lead gen pages average 5–10% for paid traffic (lower from organic search where intent varies). If you’re significantly below benchmark, optimize the landing page before scaling spend. Google Ads-Specific KPIs Quality Score Google’s 1–10 rating of your ad’s relevance to the search query. It directly impacts your cost per click — a Quality Score of 9 can cut your CPC by 50% compared to a Score of 4. The three components: Expected CTR (based on historical performance), Ad Relevance (how closely the ad matches search intent), and Landing Page Experience (speed, relevance, ease of navigation). Impression Share and Search Lost IS Impression Share tells you what percentage of eligible impressions you’re winning. “Search Lost IS (Budget)” shows how much share you’re losing due to insufficient budget — a direct indicator of untapped opportunity. “Search Lost IS (Rank)” shows loss due to low Quality Score or bids — an optimization signal, not a budget signal. Search Term Match Rate The percentage of your traffic coming from intended search terms vs irrelevant queries. Poor match rate means budget waste. A well-managed Google Ads account reviews the Search Terms report weekly, adding negatives for irrelevant queries and identifying new exact match keywords from high-performing search terms. Meta Ads-Specific KPIs Frequency The average number of times an individual has seen your ad. Frequency above 2.5–3 typically signals audience saturation — the same people are seeing the same ad repeatedly, engagement drops, CPMs rise, and CTR falls. Solutions: refresh creative, expand audience (increase lookalike percentage), or pause the ad set to allow audience refreshment. CPM Trends Rising CPMs can signal increased competition for your audience, auction dynamics tightening, or creative quality declining (Meta charges more to serve low-engagement ads). A CPM spike with no seasonality explanation usually means creative is burning out. New creative reliably resets CPMs when creative quality is the cause. Email Marketing KPIs Open Rate: Industry average 20–25% for e-commerce, 30–35% for professional services. Below benchmark indicates deliverability issues or subject line problems. Click-to-Open Rate (CTOR): Clicks ÷ Opens — measures content quality, not subject line. Industry average 10–15%. Low CTOR means the email body isn’t delivering on what the subject line promised. Revenue Per Email: Total revenue from a send ÷ emails delivered. The ultimate email efficiency metric — compare across campaign types (promotional vs automated flows) to understand where email revenue is actually generated. Unsubscribe Rate: Should be below 0.2% per send. Above this signals content-audience mismatch or send frequency issues. SEO KPIs That Actually Matter Organic Clicks: Not sessions — clicks from Search Console. Tracks actual search-driven visits. Average Position: A
LinkedIn Marketing for B2B Brands: A Complete Guide
For B2B brands, LinkedIn is not optional — it’s the highest-intent professional network on the planet. Decision-makers, procurement managers, founders, and department heads are actively on LinkedIn and, crucially, are in a professional mindset when they engage with content. This guide covers the complete LinkedIn marketing playbook for B2B brands in 2026: organic content, LinkedIn Ads, ABM, and employee advocacy. Why LinkedIn Is the #1 B2B Marketing Channel in 2026 LinkedIn has 1 billion+ members, with 65 million decision-makers and 180 million senior-level influencers among its users. More importantly, LinkedIn users self-report their professional identity: job title, company, seniority, industry, skills. This makes targeting on LinkedIn uniquely precise — you can reach “VP of Marketing at SaaS companies with 50–500 employees” with near-perfect accuracy. Compared to other platforms: Facebook and Instagram reach a broad population but lack professional context. Google Search captures intent but only when someone is actively searching. LinkedIn captures professional identity and context, which means your ads and content are reaching the right person in the right professional frame of mind — the combination that drives B2B pipeline. Building a Company Page That Actually Gets Engagement Most company pages are treated as digital brochures — a logo, a tagline, and the occasional product announcement. This approach generates minimal organic reach and no meaningful engagement. High-performing company pages have three things in common: A clear, specific value proposition in the tagline: Not “We help businesses grow” but “Performance marketing for D2C brands scaling from ₹1Cr to ₹10Cr” Content that teaches, not promotes: The pages with the highest organic reach post genuinely useful industry insights, data, frameworks, and perspectives — not sales content Consistent posting cadence: LinkedIn’s algorithm rewards consistency. 4–5 posts per week from a company page with strong engagement typically sees 3–5x more organic reach than pages that post sporadically LinkedIn Content Strategy: What Types of Posts Work Thought Leadership Posts The highest-performing content format on LinkedIn for B2B brands. A contrarian perspective, a hot take on an industry trend, or a framework for thinking about a common problem generates significant engagement from professionals who want to engage with ideas. The format: make a clear claim, support it with evidence or reasoning, invite disagreement or discussion. Data and Insights Original data — even simple survey results or internal benchmarks — gets significant traction because it’s inherently shareable and citable. “We analyzed 200 Facebook Ads campaigns — here’s what the top 10% have in common” is more compelling and more shareable than any product announcement. Behind-the-Scenes and Process Content Showing how you work — the actual process, the thinking, the decisions — builds trust and differentiates you from competitors who only show outputs. A post walking through how you diagnosed and fixed a client’s underperforming ad account teaches prospects what to expect from working with you. Case Studies (Results-Led) Specific, quantified results with enough context to be believable. Not “We improved ROAS for a client” but “How we took a D2C skincare brand from 1.4x to 4.2x ROAS in 90 days through creative restructuring and audience segmentation.” The detail makes it credible; the specificity makes it memorable. Employee Advocacy Content Posts from individual employees (founders, account managers, strategists) consistently outperform company page posts in organic reach. LinkedIn’s algorithm prioritizes personal profiles over company pages. Building a culture where your team posts regularly about their work, learnings, and perspectives is one of the highest-ROI LinkedIn marketing investments. LinkedIn Ads: The Complete Overview LinkedIn Ads are expensive relative to Meta and Google — CPCs can range from $5 to $20+ for competitive B2B audiences. But the targeting precision and professional context justify the premium for high-value B2B offers. Key ad formats: Sponsored Content (Single Image and Carousel) The most common LinkedIn ad format. Appears in the feed as a promoted post. Works best with educational content, case study snippets, or event/webinar promotions. Single image ads are straightforward; carousel ads allow you to tell a multi-step story or showcase multiple case studies in one ad unit. Message Ads (InMail) Delivered directly to LinkedIn inboxes. High visibility but easily perceived as spam if poorly written. Works best for high-value offers (webinar invitations, personalized consultations, event invites) where the offer justifies the directness. Keep message ads conversational, specific, and focused on recipient benefit. Lead Gen Forms LinkedIn’s pre-filled lead capture forms dramatically reduce friction in B2B lead generation. When a user clicks your ad, a form pre-populated with their LinkedIn profile data (name, email, job title, company) opens — they submit with one tap. Conversion rates are typically 2–4x higher than driving to a landing page. Use for gated content (ebooks, reports), webinar registrations, and consultation requests. LinkedIn Targeting: Getting Laser-Precise Reach LinkedIn’s targeting options are its primary advantage over every other advertising platform for B2B: Job Title: Target specific roles (“Marketing Director,” “Head of Procurement”) — most precise for known buyer titles Job Function + Seniority: Broader than job title, works well when multiple titles describe your buyer Company Size: Filter by employee count — critical for SaaS and services businesses where company size determines fit Industry: Narrow to specific verticals (Financial Services, SaaS, Manufacturing) Skills: Target people with specific technical skills — useful for reaching practitioners vs decision-makers Company Name: Target employees at specific companies — the backbone of ABM campaigns Account-Based Marketing (ABM) on LinkedIn ABM flips the funnel: instead of casting wide and hoping decision-makers self-select, you identify your ideal accounts first and then run targeted campaigns at everyone in the buying committee within those accounts. LinkedIn is the primary digital channel for ABM because of the company-level targeting capability. A practical ABM approach on LinkedIn: Build a list of 50–200 target accounts. Upload as a Company Audience in LinkedIn Campaign Manager. Run sponsored content campaigns targeting “Marketing Manager to CMO level” within those specific companies. Pair this with sales outreach, so prospects are seeing your brand in their feed while your sales team is reaching out directly. The brand visibility from LinkedIn significantly increases reply rates on

What Makes Ad Creative Actually Convert in 2026
Creative is the variable that separates profitable ad campaigns from money-losing ones. Two campaigns with identical targeting, budget, and landing pages can have wildly different results — the only difference is the creative. In 2026, with ad costs rising and attention spans shrinking, understanding what makes creative actually convert is no longer optional. It’s the core skill. The Creative Crisis: Why Most Ads Get Ignored The average person sees between 4,000 and 10,000 ads per day. Their brain has developed a powerful filter that identifies and dismisses advertising within milliseconds. The result: most ads generate zero conscious attention, zero recall, and zero action. The brands winning in 2026 are the ones who’ve cracked the attention problem first — everything else is secondary. The creative crisis is not about production quality. Some of the highest-performing ads in 2024 and 2025 were filmed on iPhones, used no music, and had no graphics. The crisis is about relevance, authenticity, and pattern interruption. Polished, corporate-feeling creative often performs worse than raw, direct, human content because users have learned to filter it out. The 3-Second Rule: Stopping the Scroll You have approximately 3 seconds to stop a scroll. On mobile — where 70%+ of ad impressions are served — that window is even shorter. Your creative’s job in the first 3 seconds is singular: create enough curiosity, recognition, or disruption that the viewer pauses. Tactics that consistently stop scrolls in 2026: Text overlay that speaks directly to a pain point: “Why your Facebook Ads aren’t converting” stops the scroll for every advertiser in that position Strong visual contrast: Bright colors against the typical grey/white feed, or an unexpected image that doesn’t look like an ad Movement in the first frame: On video, starting with motion (not a static title card) dramatically increases view-through rates Faces looking directly at camera: Eye contact triggers social attention — we’re hardwired to notice eyes looking at us Unexpected specificity: “How we scaled a Pune-based brand from ₹2L to ₹18L/month in 4 months” stops scrollers who immediately wonder how Hook Types That Work in 2026 The hook — the first 3–5 seconds or first line of copy — determines whether anyone watches or reads the rest. The highest-performing hook frameworks in 2026: Problem-Agitate-Solution (PAS) Open with the exact problem your audience faces, make it feel urgent or painful, then introduce your solution. “Spending £5,000/month on Google Ads and watching 80% of your budget disappear on irrelevant clicks?” This works because it speaks to lived experience before making any claim. Contrarian or Surprising Statement Challenge a common belief: “More ad spend is not the answer.” or “Your lookalike audiences are hurting your results.” Contrarian hooks generate curiosity — the viewer wants to know why you’re saying the opposite of what they expected. Social Proof Hook Lead with a specific result: “3.2x ROAS in 60 days for a fashion brand that was at 1.1x when they came to us.” Specific numbers are credible in a way that vague claims aren’t. “We got incredible results” is ignored. “₹2.4Cr revenue in 90 days” gets attention. Direct Question Ask a question that your target audience would answer “yes” to: “Are you tired of Facebook Ads that burn budget without converting?” Agreement creates mental engagement — they’re already participating in your ad rather than passively watching it. Video vs Static: Which Performs Better and When The video vs static debate depends entirely on funnel stage, platform, and creative quality. The data in 2025–2026 points to some clear patterns: Top of funnel (awareness): Short-form video (15–30 seconds) wins on Meta and TikTok. Attention is captured through story and motion. Static works well on Google Display for remarketing. Mid funnel (consideration): Carousel ads for product comparison and multi-image storytelling; short explainer videos for complex products or services Bottom of funnel (conversion): Static with clear offer and CTA often outperforms video at BOF — the decision is made, the visitor needs a clear, frictionless path to convert UGC-style video (user-generated content aesthetic, whether actually user-generated or brand-produced in that style) consistently outperforms polished brand video for DTC brands at top and mid funnel. It looks like organic content, bypasses the ad filter, and builds trust faster than high-production brand spots. Ad Creative for Each Funnel Stage Top of Funnel: Make Them Aware, Not Defensive TOF creative should not sell. It should educate, entertain, or inspire. Content that positions you as helpful and knowledgeable builds the trust and familiarity that makes conversion possible later. Brand story videos, problem-focused educational content, and relatable social situations all work well at TOF. Hard product pushes at this stage get negative reactions and drive up CPMs. Mid Funnel: Build the Case for Switching MOF audiences know you exist and have some interest. Creative here should address objections, showcase differentiation, and build social proof. Comparison content (“Why brands choose us over [alternative]”), case study snippets with specific results, and reviews/testimonials from relatable customers are highly effective MOF formats. Bottom of Funnel: Make the Offer Unmissable BOF audiences need a reason to act now. Time-limited offers, free trial CTAs, specific guarantee messaging, and urgency-driven copy perform best. The creative should be direct — no ambiguity about what to do next, what they’ll get, and why now. Creative Testing: How to Test Properly Most brands “test” creative by running two versions and waiting to see which one gets more likes. This is not testing — it’s guessing with extra steps. Proper creative testing: Test one variable at a time — hook, headline, CTA, format, or offer — so you know what caused the difference Run tests with sufficient budget to exit the learning phase (typically 50+ conversion events per ad set) Use statistical significance thresholds — a result with only 60% confidence is noise Document hypotheses before testing so you’re learning, not just collecting data Build a creative log that tracks every test, hypothesis, result, and what it means for future creative AI Tools for Creative Production in 2026 AI has fundamentally changed the economics of

Understanding Customer Lifetime Value (CLV) for Better Marketing Decisions
Customer Lifetime Value (CLV or LTV) is the single most important metric most businesses don’t measure. It tells you how much revenue a customer generates over their entire relationship with your brand — and once you understand it, it completely changes how you think about acquisition costs, channel allocation, and retention investment. This guide covers how to calculate CLV, how to use it to drive marketing decisions, and how to improve it. Why CLV Is the Most Important Metric in Marketing Most businesses obsess over CAC (Customer Acquisition Cost) without understanding what they’re actually buying. A £50 CAC might be wildly profitable or completely unsustainable — it depends entirely on what that customer is worth over time. Without CLV, you’re flying blind. CLV reframes marketing from a cost center to an investment. When you know a customer is worth £480 over 24 months, you can confidently spend £120 to acquire them and still generate strong returns. When you don’t know CLV, you’re guessing at acquisition budgets and almost certainly either over- or under-investing. The Two Types of CLV: Simple vs Predictive There are two fundamental approaches to calculating CLV: Simple (Historical) CLV Historical CLV looks backward — it tells you what customers who joined in a specific cohort have actually spent over time. The basic formula: CLV = Average Order Value × Purchase Frequency × Customer Lifespan Example: An e-commerce brand with £60 average order value, 4 purchases per year, and 2.5-year average customer lifespan has a CLV of £60 × 4 × 2.5 = £600. Adjust for gross margin (say 45%) and you get a £270 gross profit LTV — meaning you can afford up to £90 CAC and still maintain a healthy 3:1 LTV:CAC ratio. Predictive CLV Predictive CLV uses machine learning and statistical modeling to forecast what a customer is likely to spend in the future, based on their behavior so far. It’s far more actionable for segmentation and personalization because it identifies which customers have high potential before they reach that potential. Predictive CLV models commonly use RFM scoring: Recency (how recently did they buy?), Frequency (how often do they buy?), and Monetary (how much do they spend?). High scores across all three dimensions identify your VIP customers; low recency with high historical frequency flags customers at risk of churning. Cohort Analysis for Historical CLV The most accurate way to measure historical CLV is through cohort analysis — grouping customers by their acquisition month and tracking their total revenue over time. This reveals patterns that aggregate data hides: Which acquisition cohorts have the highest 12-month LTV? (Often points to specific channels or campaigns that drove higher-quality customers) At what month does retention typically drop off? (Tells you when to intervene with win-back campaigns) How does CLV vary by acquisition channel? (Google Ads customers vs Facebook Ads customers vs organic search might have dramatically different LTVs) Building a monthly cohort table — acquisition month on the Y axis, months 1–24 on the X axis, cumulative revenue per customer filling each cell — gives you a complete picture of customer value trajectory. The 3:1 LTV:CAC Ratio — and When to Break It The industry benchmark is a 3:1 LTV:CAC ratio: for every pound you spend acquiring a customer, you should generate 3 pounds of lifetime gross profit. This ratio ensures you cover acquisition costs, overhead, and still generate profit. But this ratio isn’t universal. In high-growth phases, a 1.5:1 ratio might be acceptable if you’re investing in market share and expect CLV to increase as you improve retention. In mature, profitable businesses, a 4:1 or 5:1 ratio is more appropriate. The key is that CLV must exceed CAC by a margin that sustains the business model — and you need to know your CLV to make that judgment. CLV by Acquisition Channel: Optimizing Where You Invest Not all channels deliver equal CLV. This is one of the most actionable insights CLV analysis produces. A channel with a lower conversion rate but higher customer quality (better retention, higher repeat purchase rate) might be significantly more profitable than your “best” conversion channel. Organic search: Often delivers high-intent, high-retention customers who found you through informational content. CLV tends to be above average. Google Shopping / PLA: Price-conscious buyers — CLV varies widely by category. Works well in competitive categories where you have strong pricing. Facebook/Meta Ads: Highly variable. Impulse-driven purchases often have lower CLV; well-structured retargeting and lookalike campaigns targeting existing customer profiles can deliver strong CLV. Email marketing: Existing customers; the highest CLV channel for retention, not acquisition. Re-engagement campaigns and cross-sell flows directly extend CLV. Referral / word of mouth: Referred customers typically have 25–35% higher CLV than non-referred customers (established across dozens of studies). Under-invested in by most brands. Using CLV to Set Google Ads and Facebook Ads Bidding Targets Once you know CLV by channel, you can set mathematically defensible bid targets rather than guessing at CPA targets. Formula: Target CPA = CLV × Gross Margin % ÷ Target LTV:CAC Ratio Example: If your CLV is £600, gross margin is 50%, and target LTV:CAC is 3:1, your maximum allowable CPA is £600 × 0.50 ÷ 3 = £100. If your Google Ads CPA is £65, you have significant headroom to scale. If it’s £130, you’re underwater and need to optimize before scaling. Strategies to Increase CLV CLV is not fixed. Every retention investment increases it. The highest-impact CLV improvement strategies: Cross-Sell and Upsell Programs The moment after purchase is the highest intent window. Post-purchase email sequences introducing complementary products, bundle offers, or premium tier upgrades can increase average order value by 15–35%. Build these into your email automation from day one. Subscription and Membership Models Converting one-time buyers to subscribers dramatically increases both frequency and lifespan — the two biggest CLV multipliers. Even a simple replenishment subscription for consumable products can double CLV by guaranteeing the next purchase. Loyalty and Rewards Programs Well-designed loyalty programs increase purchase frequency and reduce price sensitivity. The key is making
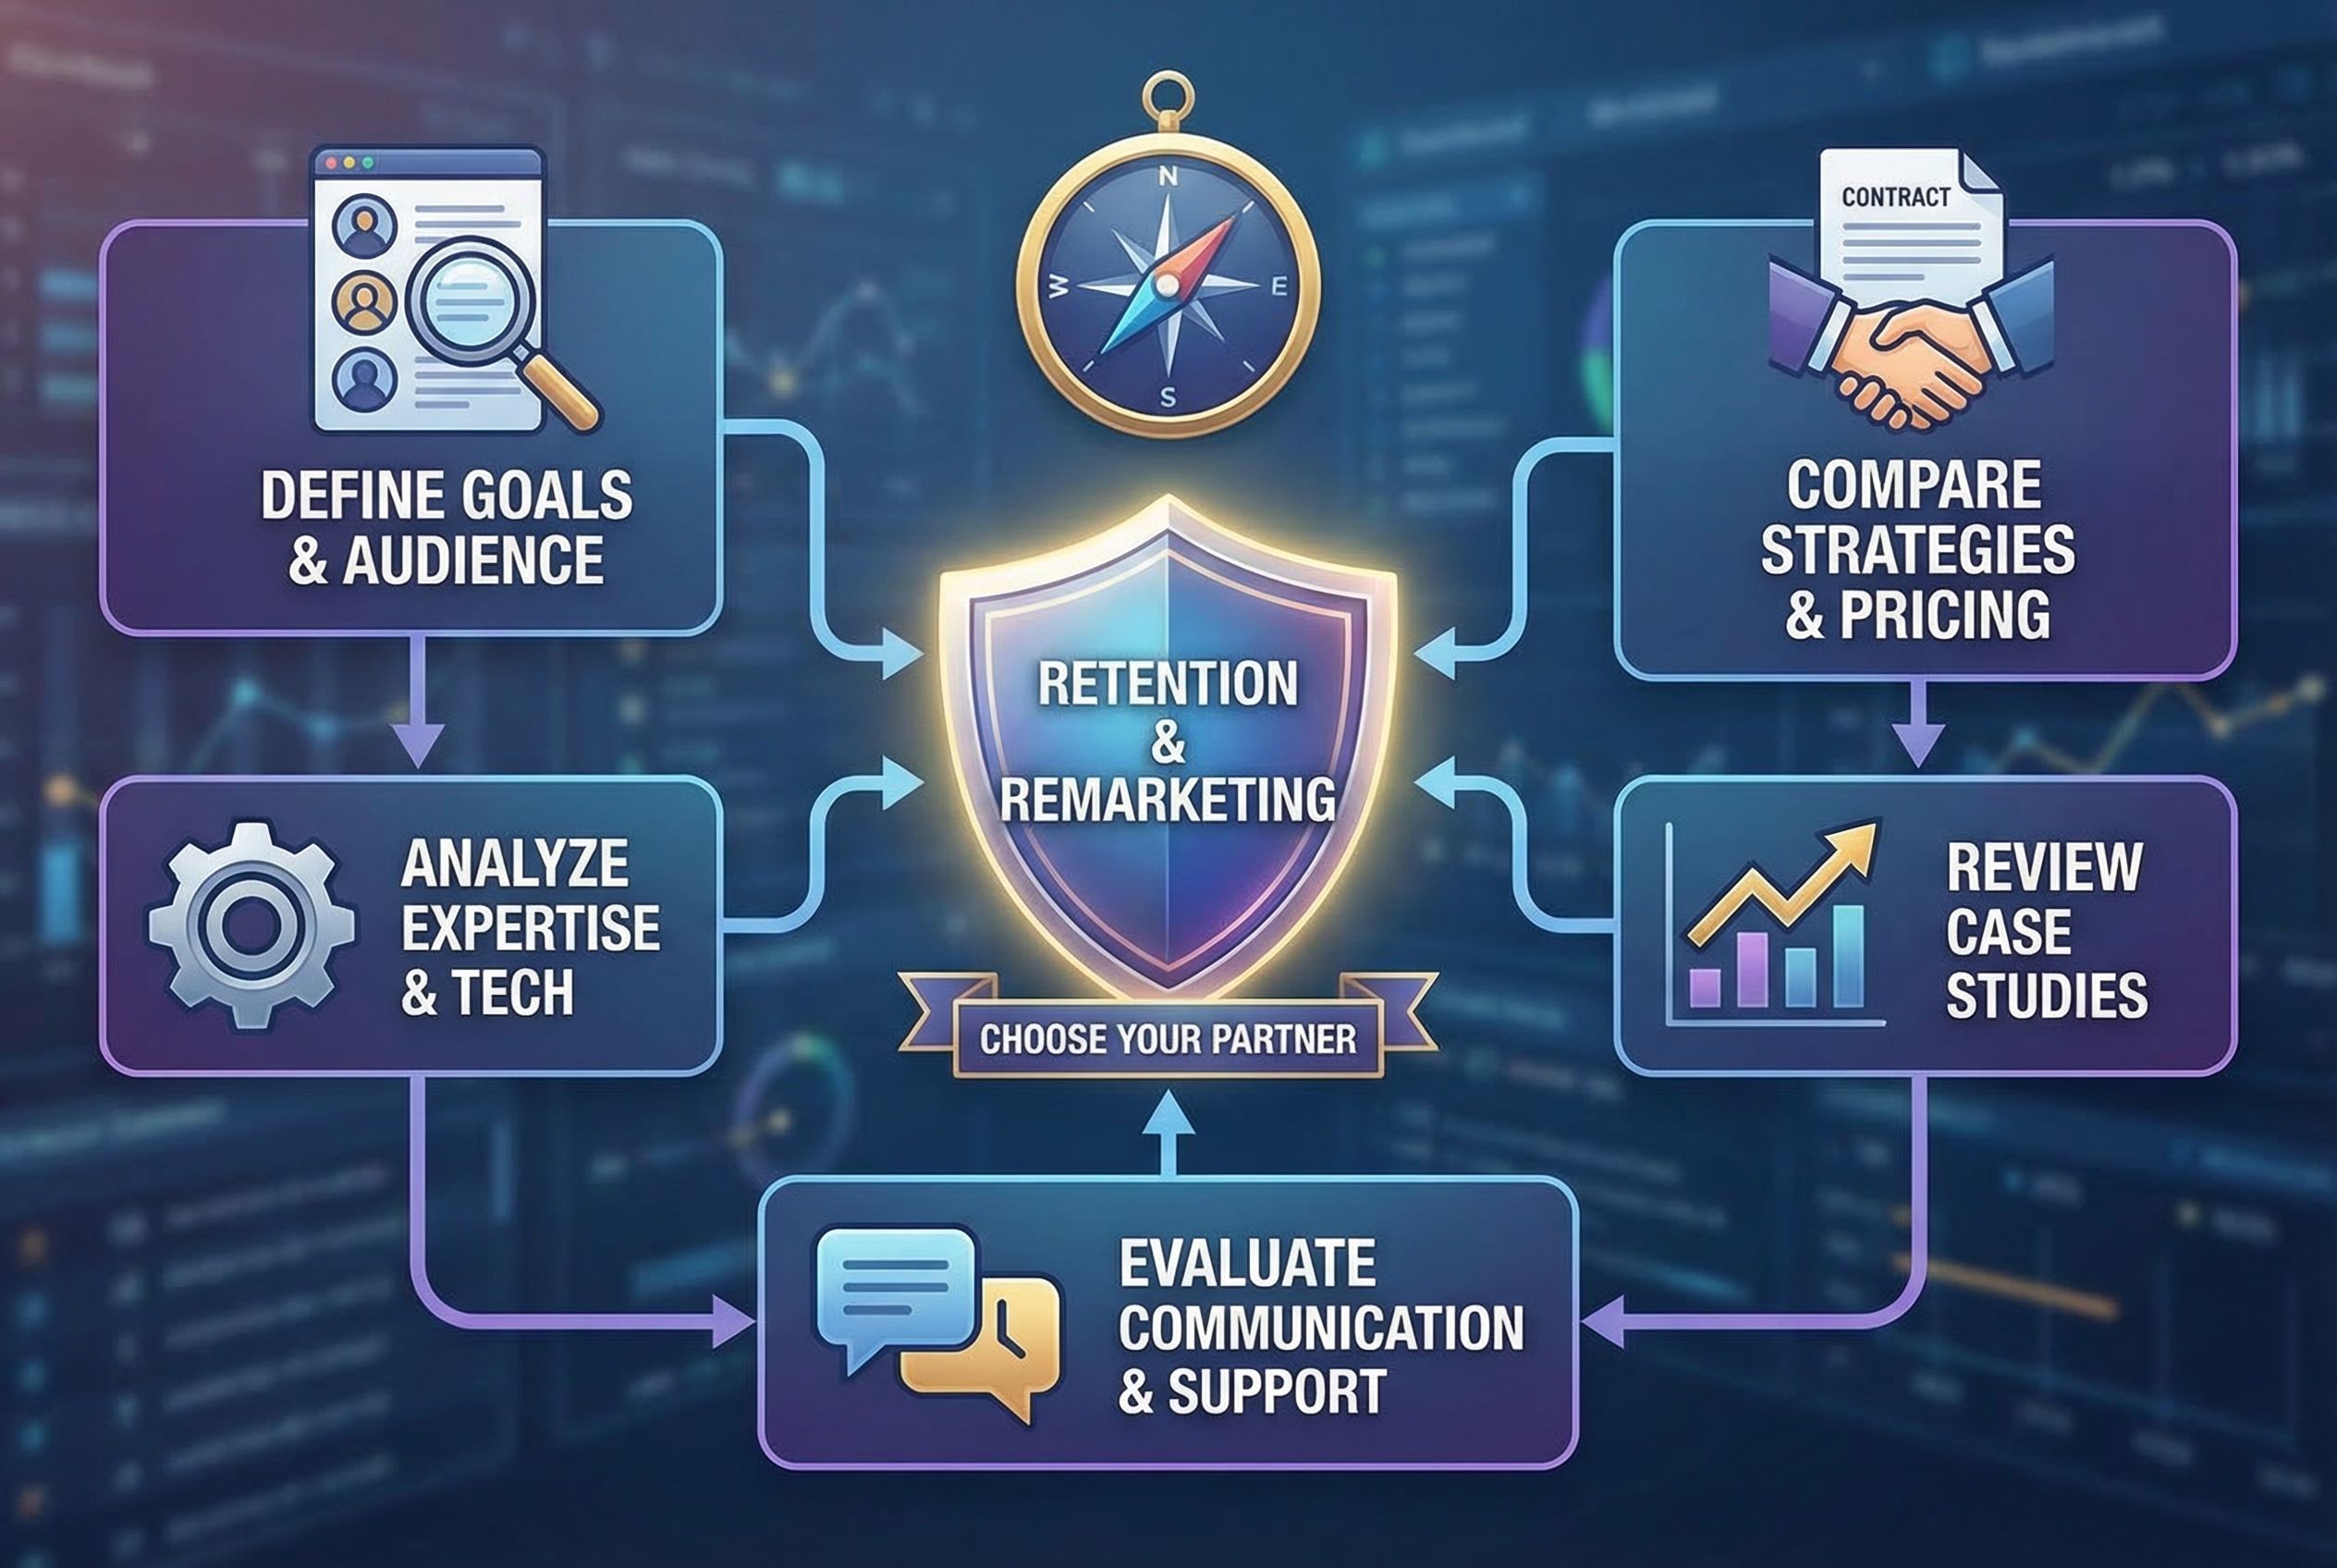
How to Choose the Top Retention and Remarketing Agency
If you want to understand how to choose the top retention and remarketing agency, it’s important to first recognize why retention marketing has become essential for modern businesses. With rising customer acquisition costs and increasing competition, companies are shifting their focus from only acquiring new customers to retaining existing ones and re-engaging potential buyers. A top retention and remarketing agency helps businesses reconnect with website visitors, nurture existing customers, and encourage repeat purchases through targeted marketing strategies. When businesses learn how to choose the top retention and remarketing agency, they can identify the right partner to build effective retention campaigns that drive long-term growth. These agencies use tools such as email marketing, SMS campaigns, retargeting ads, and customer lifecycle automation to keep customers engaged with a brand and increase customer lifetime value. By understanding how to choose the top retention and remarketing agency, businesses can build stronger relationships with their audience, improve customer engagement, and create sustainable long-term growth. Knowing how to choose the top retention and remarketing agency also ensures that businesses invest in the right expertise to maximize retention strategies and improve overall marketing performance. In this guide, we will explain what retention and remarketing agencies do, why they are important, and the key factors you should consider when selecting the right agency for your business. What Does a Top Retention and Remarketing Agency Do? A top retention and remarketing agency specializes in bringing customers back to your brand after their first interaction. Rather than focusing only on customer acquisition, these agencies create strategies to keep customers engaged and encourage repeat purchases. Retention and remarketing strategies typically include: The goal of a top retention and remarketing agency is to increase customer engagement and turn one-time buyers into long-term customers. Why Choosing the Top Retention and Remarketing Agency Matters for Business Growth Choosing the right retention and remarketing agency can have a significant impact on your business growth. Many brands invest heavily in advertising but fail to focus on retention. Without proper retention strategies, businesses lose valuable customers after the first purchase. A top retention and remarketing agency helps businesses: These benefits make retention marketing one of the most powerful growth strategies for modern businesses. Key Factors to Consider When Choosing a Top Retention and Remarketing Agency Selecting the top retention and remarketing agency requires careful evaluation. Not all marketing agencies specialize in retention marketing, so it’s important to consider several factors before making a decision. Proven Experience in Retention Marketing Services One of the most important factors when choosing a top retention and remarketing agency is experience. An agency with proven experience in retention marketing understands how to design campaigns that bring customers back to your brand. Look for agencies that have worked with businesses in your industry and can demonstrate successful retention strategies. Case studies, client testimonials, and real campaign results are strong indicators of an agency’s expertise. Data-Driven Strategy Used by Top Retention and Remarketing Agencies Retention marketing relies heavily on data and customer insights. A top retention and remarketing agency uses data analytics to understand customer behavior and improve campaign performance. Important metrics that agencies track include: By analyzing these metrics, agencies can optimize campaigns and deliver better results. Marketing Automation Tools Used by a Top Retention and Remarketing Agency Modern retention marketing depends on powerful automation tools. A top retention and remarketing agency should have experience with platforms such as: These tools allow agencies to automate marketing campaigns, personalize messages, and deliver targeted communication at the right time. Automation ensures that businesses can scale their retention strategies efficiently. Retargeting Strategies Used by the Best Retention and Remarketing Agencies Remarketing is one of the most effective ways to bring back potential customers. A top retention and remarketing agency creates retargeting campaigns that remind users about products they previously viewed or added to their cart. These campaigns typically run across platforms such as: Effective retargeting strategies can significantly improve conversion rates and recover lost sales. Customer Lifecycle Marketing Approach of a Top Retention and Remarketing Agency Every customer goes through different stages in their journey. A top retention and remarketing agency builds marketing campaigns based on the customer lifecycle. This typically includes: This approach ensures customers receive relevant messages at the right stage of their journey. Transparent Reporting from a Professional Retention and Remarketing Agency Transparency is essential when working with any marketing partner. A top retention and remarketing agency should provide detailed reports showing the performance of retention campaigns. Reports should include: Regular reporting helps businesses understand the impact of their marketing efforts. Questions to Ask Before Hiring a Top Retention and Remarketing Agency Before choosing a top retention and remarketing agency, it’s important to ask the right questions. What Retention Marketing Strategies Do You Specialize In? Different agencies specialize in different retention channels. Make sure the agency has experience with the strategies most relevant to your business. Can You Share Case Studies from Retention and Remarketing Campaigns? A reputable retention and remarketing agency should be able to provide examples of successful campaigns. Which Tools Do You Use for Retention Marketing Automation? Understanding the tools used by the agency will help you evaluate their technical capabilities. How Do You Measure Retention Marketing Success? Look for agencies that focus on metrics such as customer lifetime value, retention rate, and repeat purchase rate. Common Mistakes When Choosing a Retention and Remarketing Agency Many businesses make mistakes when selecting a marketing agency. Here are some mistakes to avoid. Choosing an Agency Based Only on Price Low-cost agencies may not always deliver strong results. Retention marketing requires expertise and strategic planning. Ignoring Industry Experience An agency that understands your industry can create more effective retention campaigns. Not Evaluating Their Strategy Always ask about the agency’s retention strategy before making a decision. Benefits of Hiring a Top Retention and Remarketing Agency Partnering with the top retention and remarketing agency offers several benefits. Increase Customer Lifetime Value with Retention Marketing Retention marketing encourages customers to purchase multiple times, increasing overall
Lookalike Audiences in Facebook Ads: The Complete Guide
Lookalike audiences are one of Meta’s most powerful targeting tools — and one of the most misused. Done correctly, they allow you to find thousands of potential customers who closely resemble your best existing customers. Done wrong, they waste budget targeting people who will never buy. This guide covers everything you need to know to build, test, and scale lookalike audiences effectively in 2026. What Are Lookalike Audiences and Why Do They Work? A lookalike audience is a targeting tool in Meta Ads Manager that finds users who share demographic characteristics, interests, and online behaviors with a source audience you define. Meta’s algorithm analyzes hundreds of data signals — from browsing habits and page interactions to purchase history and content engagement — and builds a new audience that statistically resembles your best customers. The power of lookalikes comes from scale with precision. Rather than manually assembling interest stacks and hoping they align with buyers, you’re letting Meta’s own machine learning do the heavy lifting. The algorithm knows more about its users than any manual targeting approach could capture. When your source audience is high-quality, the results can be transformative — lower CPAs, higher conversion rates, and faster scaling. Source Audiences: The Foundation of Every Lookalike The quality of your lookalike audience is entirely determined by the quality of your source audience. A weak source produces a weak lookalike. Here are the source audiences ranked by quality: 1. Customer Purchase Lists (Highest Quality) Upload a CSV of your actual paying customers — especially repeat buyers and high-value customers. This is the gold standard. Facebook matches the emails, phone numbers, or other identifiers against its user database (typically 50–70% match rate) and builds a lookalike based on verified buyers, not just visitors. 2. Pixel Purchase Events If you have enough purchase events tracked through the Meta Pixel (ideally 1,000+ in the past 90 days), this is an excellent source. It’s dynamic and self-updating — as new purchasers come in, the source refreshes automatically. For most e-commerce brands, this becomes the primary source once volume is sufficient. 3. Value-Based Customer Lists Upload your customer list with a “value” column (total spend per customer). Meta can then weight the lookalike toward users who resemble your highest-spending customers, not just any buyer. This is called a value-based lookalike and consistently outperforms flat purchase lists for scaling. 4. Video Viewers and Page Engagers Audiences based on people who watched 75%+ of a video or engaged with your Facebook/Instagram page in the last 30–60 days can work well if your other sources are too small. They’re further from purchase intent but useful for top-of-funnel lookalikes when you’re scaling a newer brand. 5. Website Visitors (Use With Caution) All website visitors is a broad, noisy source — it includes bouncers and accidental clicks. If you use website visitors, filter to a specific high-intent segment: people who visited a product page, added to cart, or spent 60+ seconds on site. The more qualified the source, the better the lookalike. 1% vs 2% vs 5% Lookalikes: Which to Use and When When creating a lookalike, you choose a percentage between 1% and 10% of the target country’s population. Here’s how to think about it: 1% lookalike: Tightest match to your source. Smallest audience, highest similarity, typically the best performance for new campaigns. Always start here. 2–3% lookalike: Broader match, larger pool. Use when 1% audiences saturate (high frequency) or when you need more volume. 5–10% lookalike: Much broader. Best for awareness campaigns or when you’ve maxed out the tighter percentages. Performance typically drops, but reach significantly increases. A practical approach: run 1% as your core performance audience. When frequency climbs above 2.5 or CPA starts rising, expand to 2% then 3%, treating each as a separate ad set so you can measure their individual performance. Stacking Lookalikes for Scale Once individual lookalike audiences are proven, stacking multiple lookalikes into a single ad set can unlock significant scale. Rather than creating separate ad sets for purchase lookalike + video viewer lookalike + page engager lookalike, combine them into one audience. Meta’s delivery system optimizes within the combined pool, often finding efficiencies across all three sources simultaneously. A typical scaling stack for e-commerce might look like: 1% purchase LAL + 1% high-value customer LAL + 1% add-to-cart LAL. These three audiences often overlap, but the combined pool gives Meta more data to optimize within. Value-Based Lookalikes: The Advanced Version Standard lookalikes treat all customers equally. Value-based lookalikes weight the algorithm toward finding users who resemble your highest LTV customers. To use this, your customer upload CSV needs a “value” column (ideally 12-month or lifetime spend). Meta requires a minimum of 100 customers with value data. The impact can be significant. In many cases, value-based lookalikes generate customers with 20–40% higher average order values and better retention rates than standard purchase lookalikes. The tradeoff is that the audience can be smaller and CPMs slightly higher. For DTC brands focused on profitability over volume, it’s worth testing. Combining Lookalikes With Interest Targeting Lookalikes and interest targeting serve different purposes. Lookalikes work best at mid-to-lower funnel where you have enough conversion data to build meaningful source audiences. Interest targeting can supplement lookalikes at the top of funnel where source data is thin. One effective combination: use interest targeting to drive initial traffic to your site, build a retargeting pixel audience, then create a lookalike off that audience once it hits 1,000+ users. This creates a “bootstrap” sequence that lets you develop lookalike-ready sources from scratch. Testing Lookalikes: Campaign Structure That Works Never launch a lookalike without a structured test. Here’s a simple but effective framework: Create a dedicated campaign for lookalike testing with a controlled budget (start at 2× your target daily CPA) Run each audience as a separate ad set so you can measure performance individually Use the same creative across all ad sets so you’re testing audience, not creative Run for at least 7 days before drawing conclusions — Meta needs time
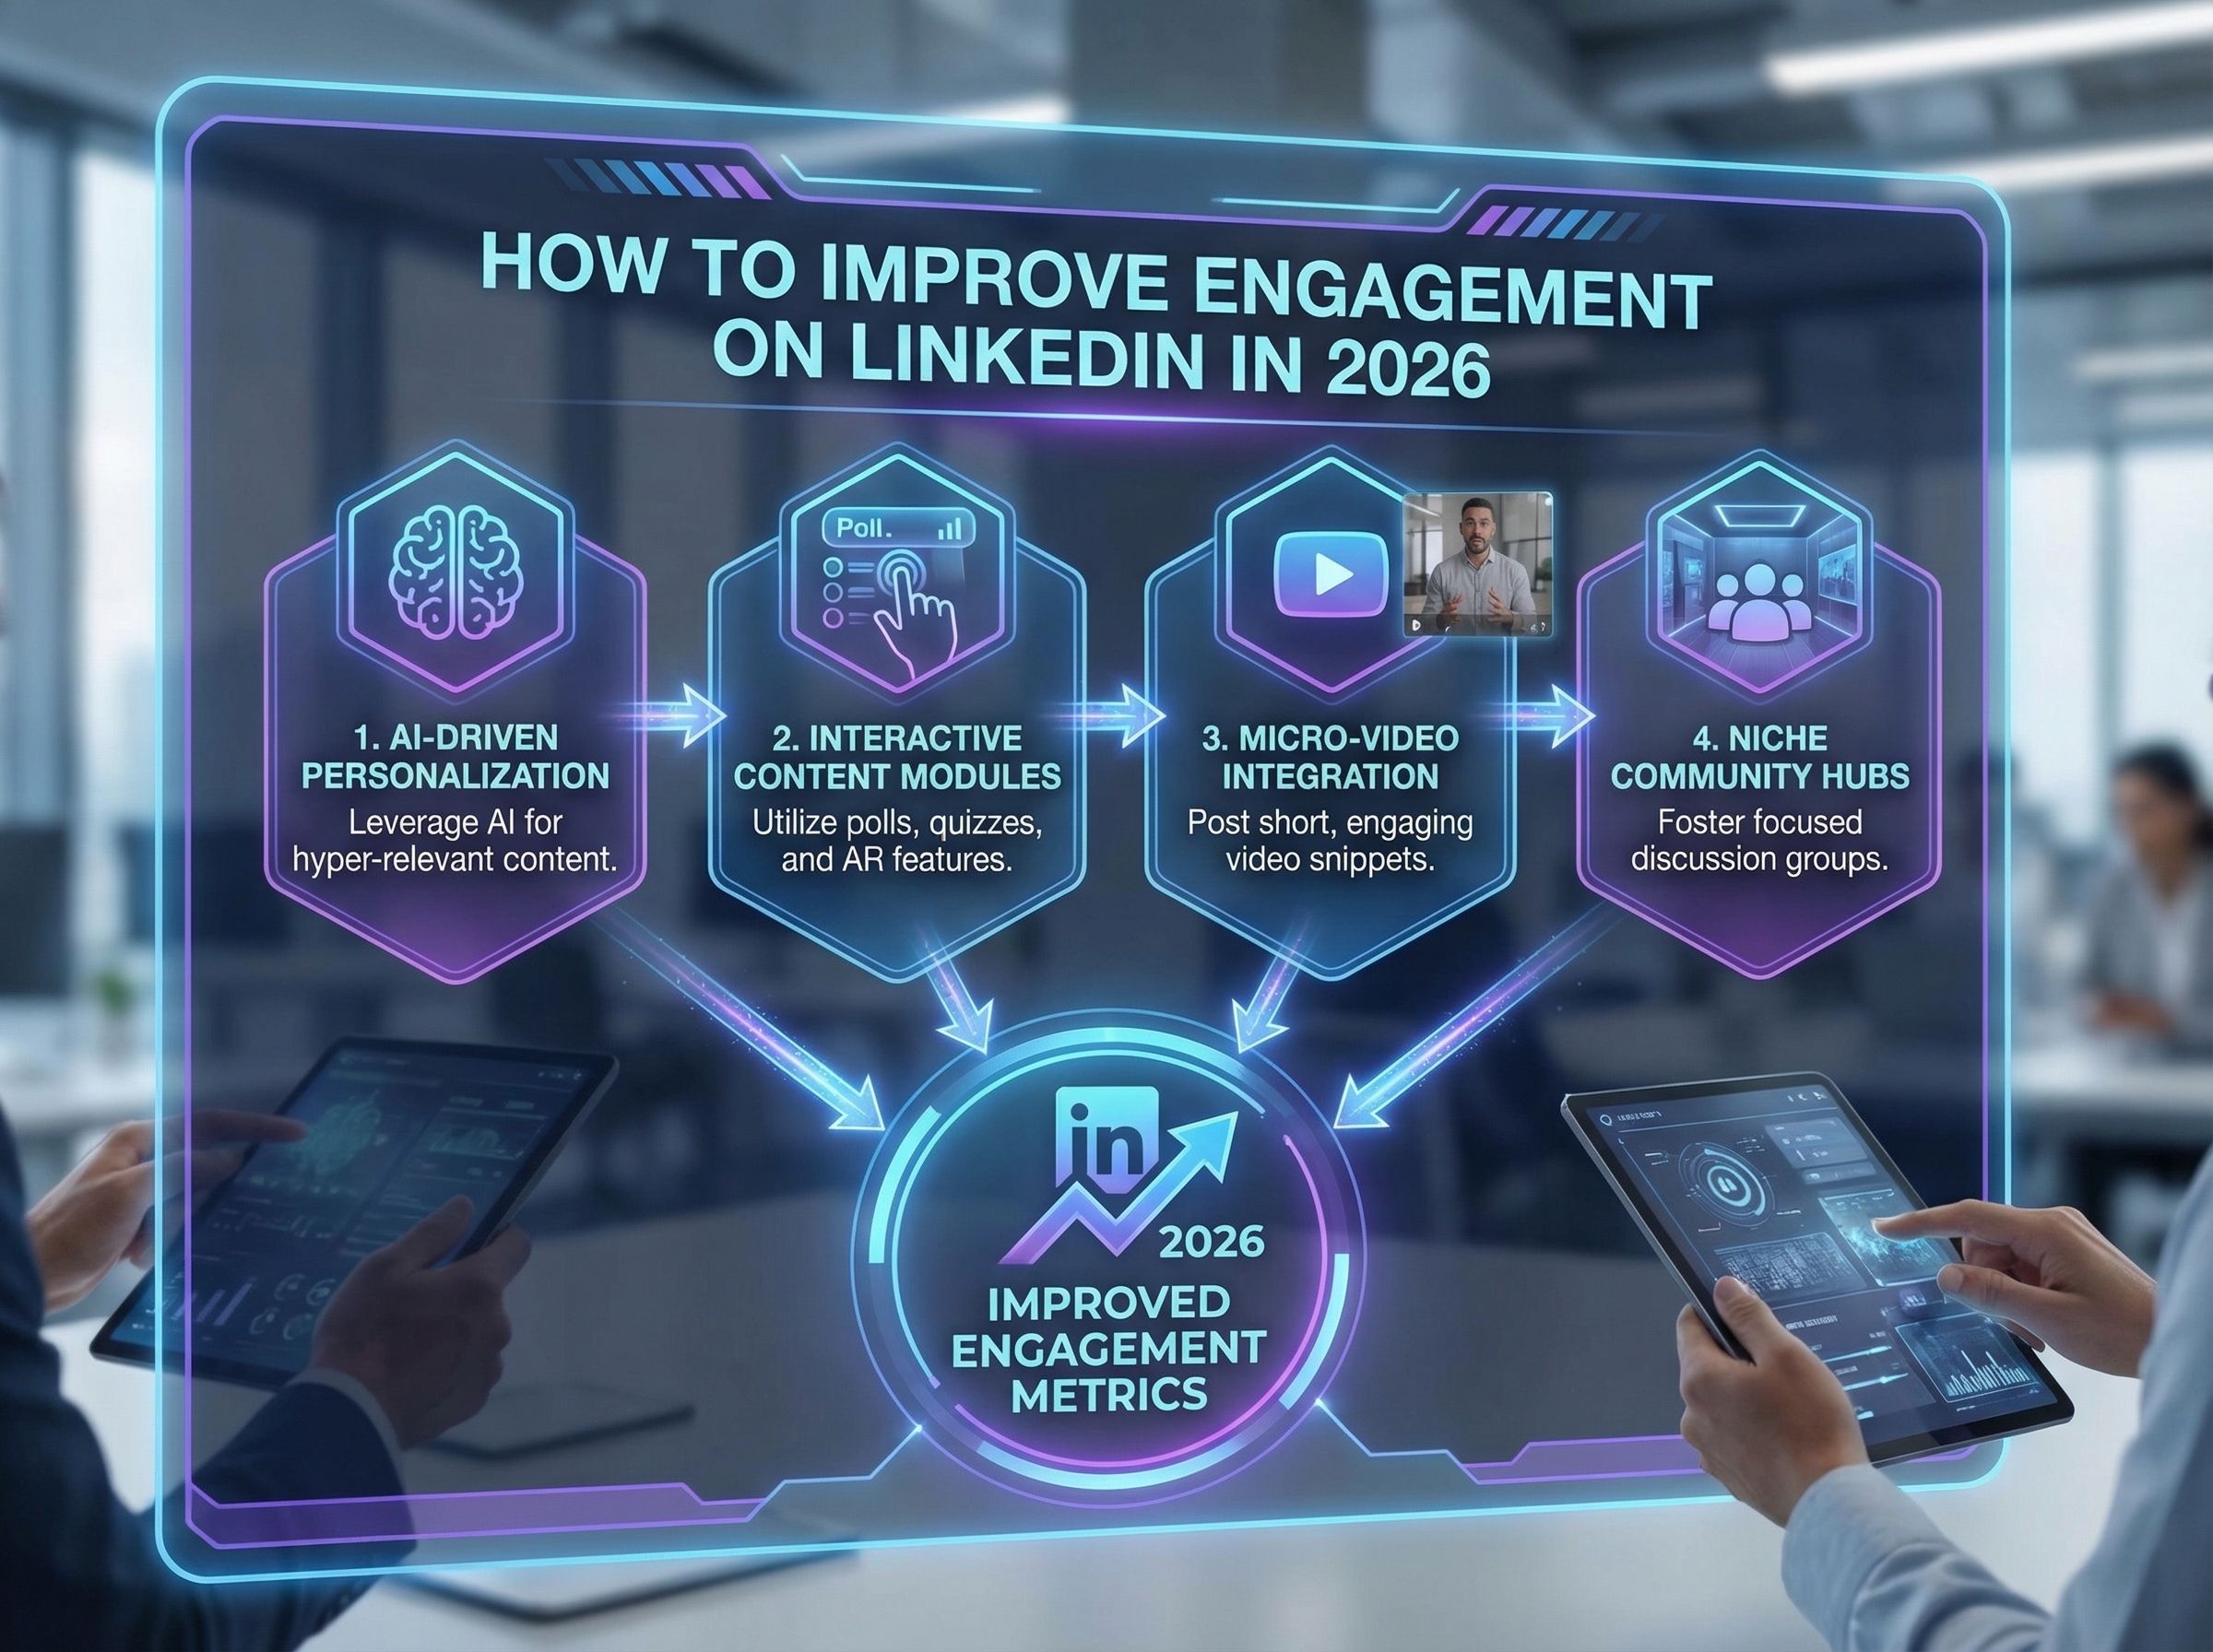
How to Improve Engagement on LinkedIn in 2026
LinkedIn has evolved into one of the most powerful platforms for professionals, founders, marketers, and businesses. However, simply posting content is no longer enough. If you truly want to improve engagement on LinkedIn in 2026, you need a well-planned content and interaction strategy. LinkedIn’s algorithm now prioritizes meaningful conversations, valuable insights, and authentic content. This means professionals who consistently share high-value posts and engage with their network will see significantly better results. Whether you are building a personal brand, growing a startup, or expanding your professional network, learning how to improve engagement on LinkedIn in 2026 can help you increase visibility, build authority, and unlock new opportunities. In this guide, we will explore proven strategies that help professionals and brands grow their audience and boost engagement on LinkedIn. Why Improving Engagement on LinkedIn in 2026 Matters Understanding the importance of engagement is the first step to learning how to improve engagement on LinkedIn in 2026. LinkedIn’s algorithm prioritizes posts that receive likes, comments, and shares shortly after being published. The more engagement your content receives, the more the platform pushes it to a larger audience. Key Benefits of Improving Engagement on LinkedIn in 2026 Professionals who focus on strategies to improve engagement on LinkedIn in 2026 often experience faster growth and stronger connections. How the LinkedIn Algorithm Affects Engagement on LinkedIn in 2026 To successfully improve engagement on LinkedIn in 2026, it is important to understand how the platform distributes content. Initial Distribution and Early Engagement on LinkedIn When you publish a post, LinkedIn initially shows it to a small group of your connections. If the content receives engagement quickly, the platform interprets it as valuable and expands its reach. Why Conversations Help Improve Engagement on LinkedIn LinkedIn prioritizes posts that encourage discussions. Comments carry more weight than likes because they indicate deeper interaction. This means content that sparks conversations is more likely to reach second and third-degree connections. 10 Proven Ways to Improve Engagement on LinkedIn in 2026 Below are the most effective strategies professionals can use to improve engagement on LinkedIn in 2026. 1. Create Valuable Content to Improve Engagement on LinkedIn High-quality content is the foundation of strong LinkedIn engagement. Posts that provide useful insights or practical advice tend to perform much better. Content Types That Improve Engagement on LinkedIn Educational and informative content naturally encourages interaction. 2. Write Strong Hooks to Improve Engagement on LinkedIn Posts The first two lines of a LinkedIn post are extremely important. A compelling hook encourages readers to click “See More,” increasing engagement. Examples of Hooks That Improve Engagement on LinkedIn Hooks create curiosity and make people want to continue reading. 3. Post Consistently to Improve Engagement on LinkedIn in 2026 Consistency plays a major role when trying to improve engagement on LinkedIn in 2026. LinkedIn rewards users who contribute regularly to the platform. Recommended Posting Frequency for LinkedIn Engagement Consistency helps build audience familiarity and trust. 4. Use Storytelling to Improve Engagement on LinkedIn Storytelling is one of the most effective ways to connect with your audience. Instead of sharing only facts or tips, try presenting your content through real experiences and lessons. A Simple Storytelling Framework for LinkedIn Posts Story-based posts often generate more comments and shares. 5. Ask Questions to Improve Engagement on LinkedIn Posts Posts that invite participation tend to perform better. One simple way to improve engagement on LinkedIn in 2026 is to ask thoughtful questions at the end of your posts. Questions That Increase LinkedIn Engagement Questions encourage readers to share their opinions. 6. Use Visual Content to Improve Engagement on LinkedIn Visual content is highly effective in capturing attention in the LinkedIn feed. Visual Formats That Improve LinkedIn Engagement Carousel posts often perform especially well because they keep users interacting longer. 7. Engage With Your Network Daily Engagement is not only about posting. If you want to improve engagement on LinkedIn in 2026, you should actively interact with your network. Daily engagement activities This activity improves visibility and relationship building. 8. Post at the Right Time Timing plays an important role in improving engagement on LinkedIn in 2026. Although the best time varies by audience, common high-performing windows include: Testing different time slots can help you identify when your audience is most active. 9. Use Relevant Hashtags Hashtags help LinkedIn categorize your content and show it to a wider audience. To improve engagement on LinkedIn in 2026, use a mix of popular and niche hashtags. Example hashtags Using 3–5 hashtags per post is generally ideal. 10. Build an Authentic Personal Brand People engage more with authentic voices than corporate messaging. One of the most effective ways to improve engagement on LinkedIn in 2026 is by sharing your perspective, experiences, and expertise. Ways to build a personal brand Authenticity builds trust and encourages interaction. Common Mistakes That Reduce LinkedIn Engagement If you are struggling to improve engagement on LinkedIn in 2026, you may be making one of these common mistakes: Avoiding these mistakes can significantly improve performance. Tools That Help Improve LinkedIn Engagement Several tools can help professionals and brands optimize their LinkedIn strategy. Popular tools include: These tools help maintain consistency and improve content quality. Conclusion Learning how to improve engagement on LinkedIn in 2026 is essential for professionals who want to grow their network, build authority, and create new opportunities. By sharing valuable content, posting consistently, using storytelling, and engaging with your audience, you can significantly increase your visibility and influence on the platform. LinkedIn is no longer just a networking platform—it is a powerful channel for personal branding, business growth, and professional success. Start applying these strategies today to see stronger engagement and meaningful connections on LinkedIn. Frequently Asked Questions (FAQs) How can I improve engagement on LinkedIn in 2026? To improve engagement on LinkedIn in 2026, focus on creating valuable content, writing strong hooks, posting consistently, and interacting with your audience through comments and conversations. What type of content performs best on LinkedIn? Educational posts, professional insights, personal stories, and
How to Set Up Conversion Tracking in Google Ads (Step-by-Step)
Conversion tracking is the single most important thing you can set up in Google Ads. Without it, you’re flying blind — you have no idea which keywords, ads, or audiences are actually driving business outcomes. Smart bidding doesn’t work. Optimisation is guesswork. And you’re almost certainly wasting a significant portion of your budget. This step-by-step guide walks you through setting up conversion tracking correctly, from defining what counts as a conversion to verifying your tag is firing accurately. Why Conversion Tracking Is Non-Negotiable Google Ads without conversion tracking is the equivalent of running a sales team with no CRM — you’re spending money on activity with no visibility into what’s actually working. Every smart bidding strategy (Target CPA, Target ROAS, Maximize Conversions) requires conversion data to function. The moment you activate one of these strategies without proper tracking, the algorithm optimises toward phantom goals and your budget evaporates. Beyond bidding, conversion data tells you which campaigns, ad groups, keywords, and ads generate real business results. Without it, you’re making budget allocation decisions based on clicks and impressions alone — vanity metrics that don’t correlate reliably with revenue. Step 1: Define Your Conversion Actions Before adding any code, decide what a “conversion” means for your business. Common conversion actions include: form submission (contact/lead form), purchase or transaction, phone call from ad or website, app download, newsletter sign-up, and page visit for awareness campaigns. Primary vs secondary conversions: In Google Ads, you designate each conversion action as either Primary (used for bidding) or Secondary (reporting only). This distinction matters enormously. Avoid marking too many actions as primary conversions — Google’s algorithm optimises toward whatever you mark as primary. If you mark both “visited homepage” and “submitted contact form” as primary, the algorithm will optimise toward the easier one (homepage visits) and your lead quality will suffer. Best practice: Mark only your highest-value action as Primary. For lead generation businesses, this is typically the contact form submission. For e-commerce, it’s the purchase confirmation page. Everything else — add to cart, product page view, time on site — should be set as Secondary. Step 2: Create a Conversion Action in Google Ads Go to Google Ads → Tools → Measurement → Conversions Click + New conversion action Select Website (for form submissions or purchases) Enter your website URL and let Google scan it Choose the action type (Purchase, Submit lead form, etc.) Set the conversion value — use actual revenue for purchases, estimated value for leads Set count: “One” for leads (one conversion per click), “Every” for purchases Set the conversion window — 30 days is standard for most businesses Set the attribution model — Data-driven attribution is recommended for accounts with sufficient data; Last click for simpler setups Step 3: Install the Google Tag via Google Tag Manager The recommended installation method is via Google Tag Manager (GTM). GTM lets you deploy and manage tracking tags without editing your website’s code directly — reducing the risk of breaking your site and making future tracking changes much faster. Setting Up GTM (if you haven’t already) Go to tagmanager.google.com and create an account and container for your website Add the GTM snippet to your site — one code goes in the <head> and one in the <body> For WordPress sites, use the “GTM4WP” plugin for a clean installation Adding Your Google Ads Conversion Tag in GTM In GTM, click Tags → New → Tag Configuration → Google Ads Conversion Tracking Enter your Conversion ID and Conversion Label (found in Google Ads → Conversions → select your action → Tag Setup) For a “thank you page” trigger: create a Trigger of type “Page View” where “Page URL contains /thank-you” (adjust to your actual confirmation URL) For a form submission without a thank-you page: use a “Form Submission” trigger with the specific form ID Save, preview in GTM debug mode to verify it fires, then submit and publish Step 4: Setting Up Purchase Tracking for E-Commerce E-commerce conversion tracking requires passing the actual transaction value to Google Ads — otherwise you can only count conversions, not revenue, making Target ROAS and Maximize Conversion Value impossible to use effectively. In GTM, create a Data Layer variable that captures the order total from your checkout confirmation page. Your developer needs to push this value into the data layer on the order confirmation page. The tag then reads this variable and passes it to Google Ads as the conversion value. This enables accurate ROAS reporting and smart bidding based on real revenue data. For WooCommerce and Shopify stores, there are pre-built integrations that handle this automatically — verify they’re passing values correctly by checking your conversion reports and looking for non-zero “Conversion Value” columns. Step 5: Testing Your Conversion Tag with Tag Assistant Never go live with conversion tracking without testing it first. A misfiring tag is worse than no tag — it sends incorrect data to Google’s algorithm and corrupts your performance history. Install the Google Tag Assistant Companion Chrome extension Navigate through your conversion flow (fill out the form or complete a test purchase) Tag Assistant will show whether your Google Ads conversion tag fired correctly and what data was passed In Google Ads, you can also see “Unverified” status change to “Recording” once a live conversion is detected — this typically takes 24–48 hours after a real conversion fires Cross-Device Conversions and View-Through Conversions Modern buyer journeys rarely happen on a single device. Someone may click your ad on mobile, then convert on desktop later. Google’s cross-device conversion tracking, powered by signed-in Google accounts, attributes these multi-device paths to the original ad click. View-through conversions track cases where a user saw your Display or Video ad but didn’t click it, yet converted within the conversion window. These are counted separately in Google Ads and should not be used as a basis for smart bidding — they’re useful for understanding the assisted impact of your brand campaigns but can inflate apparent performance if confused with direct-response conversions.

SEO vs Paid Ads: Which Should You Invest in First?
One of the most common questions businesses ask when starting digital marketing: “Should we focus on SEO or paid ads?” The honest answer is that both serve different purposes and both are valuable — but the right starting point depends on your timeline, budget, competitive landscape, and business stage. Getting this decision wrong is expensive. Here’s a framework to get it right. The Core Difference: Time vs Money SEO and paid advertising are fundamentally different trades. SEO trades time for traffic — you invest months in content, technical optimisation, and link building, and the rewards compound over years. Paid ads trade money for traffic — you get clicks immediately, but they stop the moment you stop spending. Neither is inherently better. The question is which makes more sense given where your business is right now. Most businesses that ask “SEO or paid ads?” are really asking: “How quickly do I need results, and how much budget do I have?” When SEO Makes Sense First SEO should be your primary investment when one or more of the following apply: You have a limited paid ads budget: If you can’t sustain ₹50,000-100,000/month in ad spend, paid advertising becomes unsustainable. SEO builds an asset that works without ongoing spend. Your customers research before buying: For considered purchases — B2B services, SaaS, high-ticket products — organic search captures buyers in research mode. These leads are often higher quality than paid traffic. You’re in a content-heavy industry: Blogs, guides, comparison pages, and how-to content rank well organically and build authority. SEO is the natural distribution channel for content-driven businesses. You’re playing a long game: If you’re building a brand for 5+ years, SEO compounds into a competitive moat that becomes increasingly expensive for competitors to replicate. Your paid CPCs are extremely high: In industries where keywords cost ₹500-2,000 per click (legal, finance, insurance, competitive B2B), organic ranking for the same terms delivers the same high-intent traffic at zero marginal cost. When Paid Ads Make Sense First Paid advertising should be your starting point when: You need revenue immediately: A new product launch, a seasonal business, or a startup that needs to prove unit economics before investing in long-term channels — paid ads generate traffic and revenue within days, not months. You’re in a hyper-competitive organic landscape: Some industries are dominated by established players with years of domain authority and thousands of backlinks. Ranking organically would take 12-24 months. Paid ads let you compete immediately. You’re testing product-market fit: Paid traffic is the fastest way to validate whether your offer converts. Before investing months in SEO, use paid ads to confirm your landing page, pricing, and messaging actually work. Your sales cycle is short: E-commerce, local services, and impulse purchases benefit more from paid ads because the customer is ready to buy now — they don’t need a 6-part content series to nurture them. The True Cost of SEO SEO is not free. The common misconception that organic traffic costs nothing ignores the real inputs required: Content creation: High-quality, comprehensive content that ranks for competitive keywords requires significant investment in research, writing, and design. A single pillar page can cost ₹15,000-50,000 to produce properly. Link building: Earning authoritative backlinks requires outreach, relationship building, or link-earning content campaigns — all of which take time and resource. Technical SEO: Site speed, Core Web Vitals, structured data, crawlability — these require developer time and ongoing maintenance. Time to results: A new website in a competitive industry might take 6-18 months to see meaningful organic traffic. That’s 6-18 months of investment before significant return. The payoff is compounding returns. A page that ranks #1 for a high-volume keyword can drive hundreds of thousands of visitors over years with minimal additional investment. The ROI of SEO, calculated over a 3-5 year horizon, typically dwarfs paid advertising ROI. The True Cost of Paid Ads Paid advertising costs are more visible but often underestimated: Ad spend: The money going directly to Google, Meta, or other platforms. This scales linearly — more clicks means more spend. Creative production: Ad copy, images, videos, and landing pages need regular refreshing to combat creative fatigue. Budget 20-30% of your ad spend for creative production. Management fees: Running paid campaigns effectively requires expertise in audience targeting, bidding strategies, conversion optimisation, and creative testing. Agency fees or in-house talent add to total cost. The traffic cliff: When you pause campaigns, traffic stops immediately. Unlike SEO, paid advertising builds no lasting asset. ROI Comparison: Month 1 vs Month 12 The ROI profile of SEO and paid ads looks completely different depending on your time horizon: Month 1: Paid ads generate immediate traffic and potentially immediate revenue. SEO generates almost nothing — you’re still building technical foundations and publishing early content. Month 6: Paid ads continue at steady cost per acquisition. SEO begins generating some organic traffic for lower-competition keywords, reducing blended CAC. Month 12: A well-executed SEO strategy is now contributing meaningful organic traffic. The cost per organic visitor is falling as your content library grows. Paid ads still deliver volume but at higher cost as competition increases. Month 24+: SEO is now delivering traffic at near-zero marginal cost. Brands that invested in SEO early have a significant cost advantage over competitors who rely solely on paid channels. How SEO and Paid Ads Make Each Other Better The best strategy isn’t choosing one over the other — it’s running both strategically and letting them reinforce each other: Google Ads data informs SEO: Your paid search campaigns reveal which keywords convert, which ad copy resonates, and which landing page messages drive purchases. Use this data to prioritise your organic content strategy. SEO content lowers paid ad costs: High-quality, relevant landing pages improve Google Ads Quality Score, which directly reduces your cost per click. Brands with strong organic presence often pay 20-40% less per click than competitors. Organic content fuels remarketing: Blog readers, guide downloaders, and video viewers become warm remarketing audiences for your paid campaigns — converting at lower cost

D2C Brand Marketing: 7 Strategies That Actually Work in India
India’s D2C ecosystem has exploded over the past five years. Brands like boAt, Mamaearth, Sugar Cosmetics, and Licious have proven that you don’t need a retail distribution network to build a ₹1,000 crore business. But for every brand that’s scaled, hundreds have stalled — usually not because of a bad product, but because of poor marketing execution. Here are 7 strategies that consistently work for Indian D2C brands in 2025 and beyond. The D2C Revolution in India India’s D2C market is projected to reach $100 billion by 2025, driven by 750 million internet users, rising smartphone penetration in Tier 2 and Tier 3 cities, and a generation of consumers who discovered online shopping during the pandemic and never looked back. The opportunity is enormous — but so is the competition. The brands winning in this environment aren’t just building great products. They’re building marketing systems that acquire customers profitably, retain them effectively, and turn them into advocates. The 7 strategies below are the building blocks of those systems. Strategy 1: Build a Strong Brand Identity (Not Just a Product Brand) The most common mistake Indian D2C founders make is launching with a product focus and no brand strategy. In crowded categories — personal care, food and beverage, fashion, home goods — product quality alone doesn’t create loyalty. Brand identity does. A strong brand identity includes: a clear point of view (what you stand for beyond your product), a consistent visual language (colours, typography, photography style), packaging that creates an unboxing experience worth sharing, and a brand voice that feels human and distinctive across all touchpoints. Mamaearth built its ₹7,000 crore brand not just on toxin-free beauty products but on a sustainability narrative that resonated with millennial mothers. That narrative, consistently communicated, is the actual business moat. Strategy 2: Nail Your Performance Marketing Funnel Performance marketing for D2C isn’t a single campaign — it’s a funnel with three distinct stages, each requiring different creative, audience targeting, and optimisation strategies. Top of Funnel: Awareness Use Meta and Instagram to introduce your brand to cold audiences who match your ideal customer profile. Video ads (15-30 seconds) and Reels work best at this stage. Optimise for reach and video views, not conversions. The goal is brand recall, not immediate purchase. Middle of Funnel: Consideration Retarget website visitors, video viewers, and Instagram engagers with UGC (user-generated content), product reviews, and comparison content. This is where social proof does the heavy lifting. A real customer talking about your product outperforms branded content 3-5x at this stage. Bottom of Funnel: Conversion Cart abandoners and high-intent visitors need conversion-optimised landing pages, offer-driven ads (first purchase discount, free shipping, bundle deals), and urgency messaging. Ensure your landing page loads in under 3 seconds on mobile — every second of delay costs you 7% of conversions. Strategy 3: Leverage User-Generated Content Indian consumers are deeply influenced by peer recommendations — more so than polished brand advertising. UGC (unboxing videos, reviews, before-and-after content, product demonstrations) consistently outperforms branded creative in both engagement and conversion rates. Build a systematic UGC collection programme: send post-purchase emails asking for reviews, create branded hashtags, offer loyalty points for photo/video submissions, and feature customer content prominently on your product pages and ads. The brands with the most UGC in their ad accounts have the lowest CPAs — because they’re letting customers sell for them. Strategy 4: WhatsApp Marketing for Retention India has 500 million WhatsApp users and open rates for WhatsApp business messages of 90%+ — compared to 20-25% for email. If you’re not using WhatsApp as a retention channel, you’re leaving significant repeat purchase revenue on the table. Set up the WhatsApp Business API (through providers like Interakt, Wati, or AiSensy). Build automated flows for: order confirmation and shipping updates, post-delivery check-ins and review requests, reorder reminders for consumable products, and personalised offers based on purchase history. Unlike email, WhatsApp messages feel personal and immediate — which is why D2C brands using it report 30-50% higher repeat purchase rates. Strategy 5: Influencer Marketing Done Right Influencer marketing in India is often done wrong: brands chase celebrity follower counts, pay enormous fees for single posts, and measure success by impressions rather than conversions. The brands that actually get ROI from influencer marketing do it differently. Micro-influencers (10,000-100,000 followers) in specific niches consistently outperform mega-influencers for D2C brands. Their audiences are more engaged, their content is more authentic, and their rates are 10-20x lower. A skincare brand working with 50 micro-influencers who focus on beauty, wellness, and lifestyle will generate more qualified traffic than a single post from a Bollywood celebrity. Vet influencers beyond follower count: check engagement rate (likes + comments / followers), audience demographics, past brand partnerships, and content quality. Always use trackable links or unique discount codes to measure actual conversions from each influencer. Strategy 6: Email and SMS Retention Loops Acquiring a customer is 5x more expensive than retaining one. Yet most D2C brands invest the vast majority of their marketing budget in acquisition and almost nothing in retention. Email and SMS automation changes this equation dramatically. Essential automated sequences every D2C brand should have: a welcome series (3-5 emails introducing your brand story, values, and bestsellers), a post-purchase sequence (thank you, usage tips, review request, cross-sell recommendations), a win-back sequence for customers who haven’t bought in 60-90 days, and a loyalty programme communication flow (points earned, rewards available, VIP tier upgrades). Brands with mature email and SMS programmes typically generate 30-40% of their revenue from these owned channels — at near-zero marginal cost. Strategy 7: Regional Language Marketing More than 70% of India’s internet users prefer content in their regional language over English. Yet most D2C brands market exclusively in English, effectively cutting themselves off from the massive Tier 2 and Tier 3 city opportunity. Brands that run Hindi, Tamil, Telugu, Marathi, and Kannada ad variants consistently see 20-40% lower CPAs in regional markets compared to English-only campaigns. The same applies to product pages and WhatsApp communications. You don’t need to
